Outputs From The LIC DSF Template
Welcome to Station 6! It will guide you through all the LIC DSF outputs that are automatically produced by the template once all the assumptions in the input sheets have been entered.
 |
|
Substation 6.1 - Baseline Substation 6.2 - Stress Tests Substation 6.3 - Sensitivity Analysis Substation 6.4 - Risk Rating & Other Ouputs |
 |
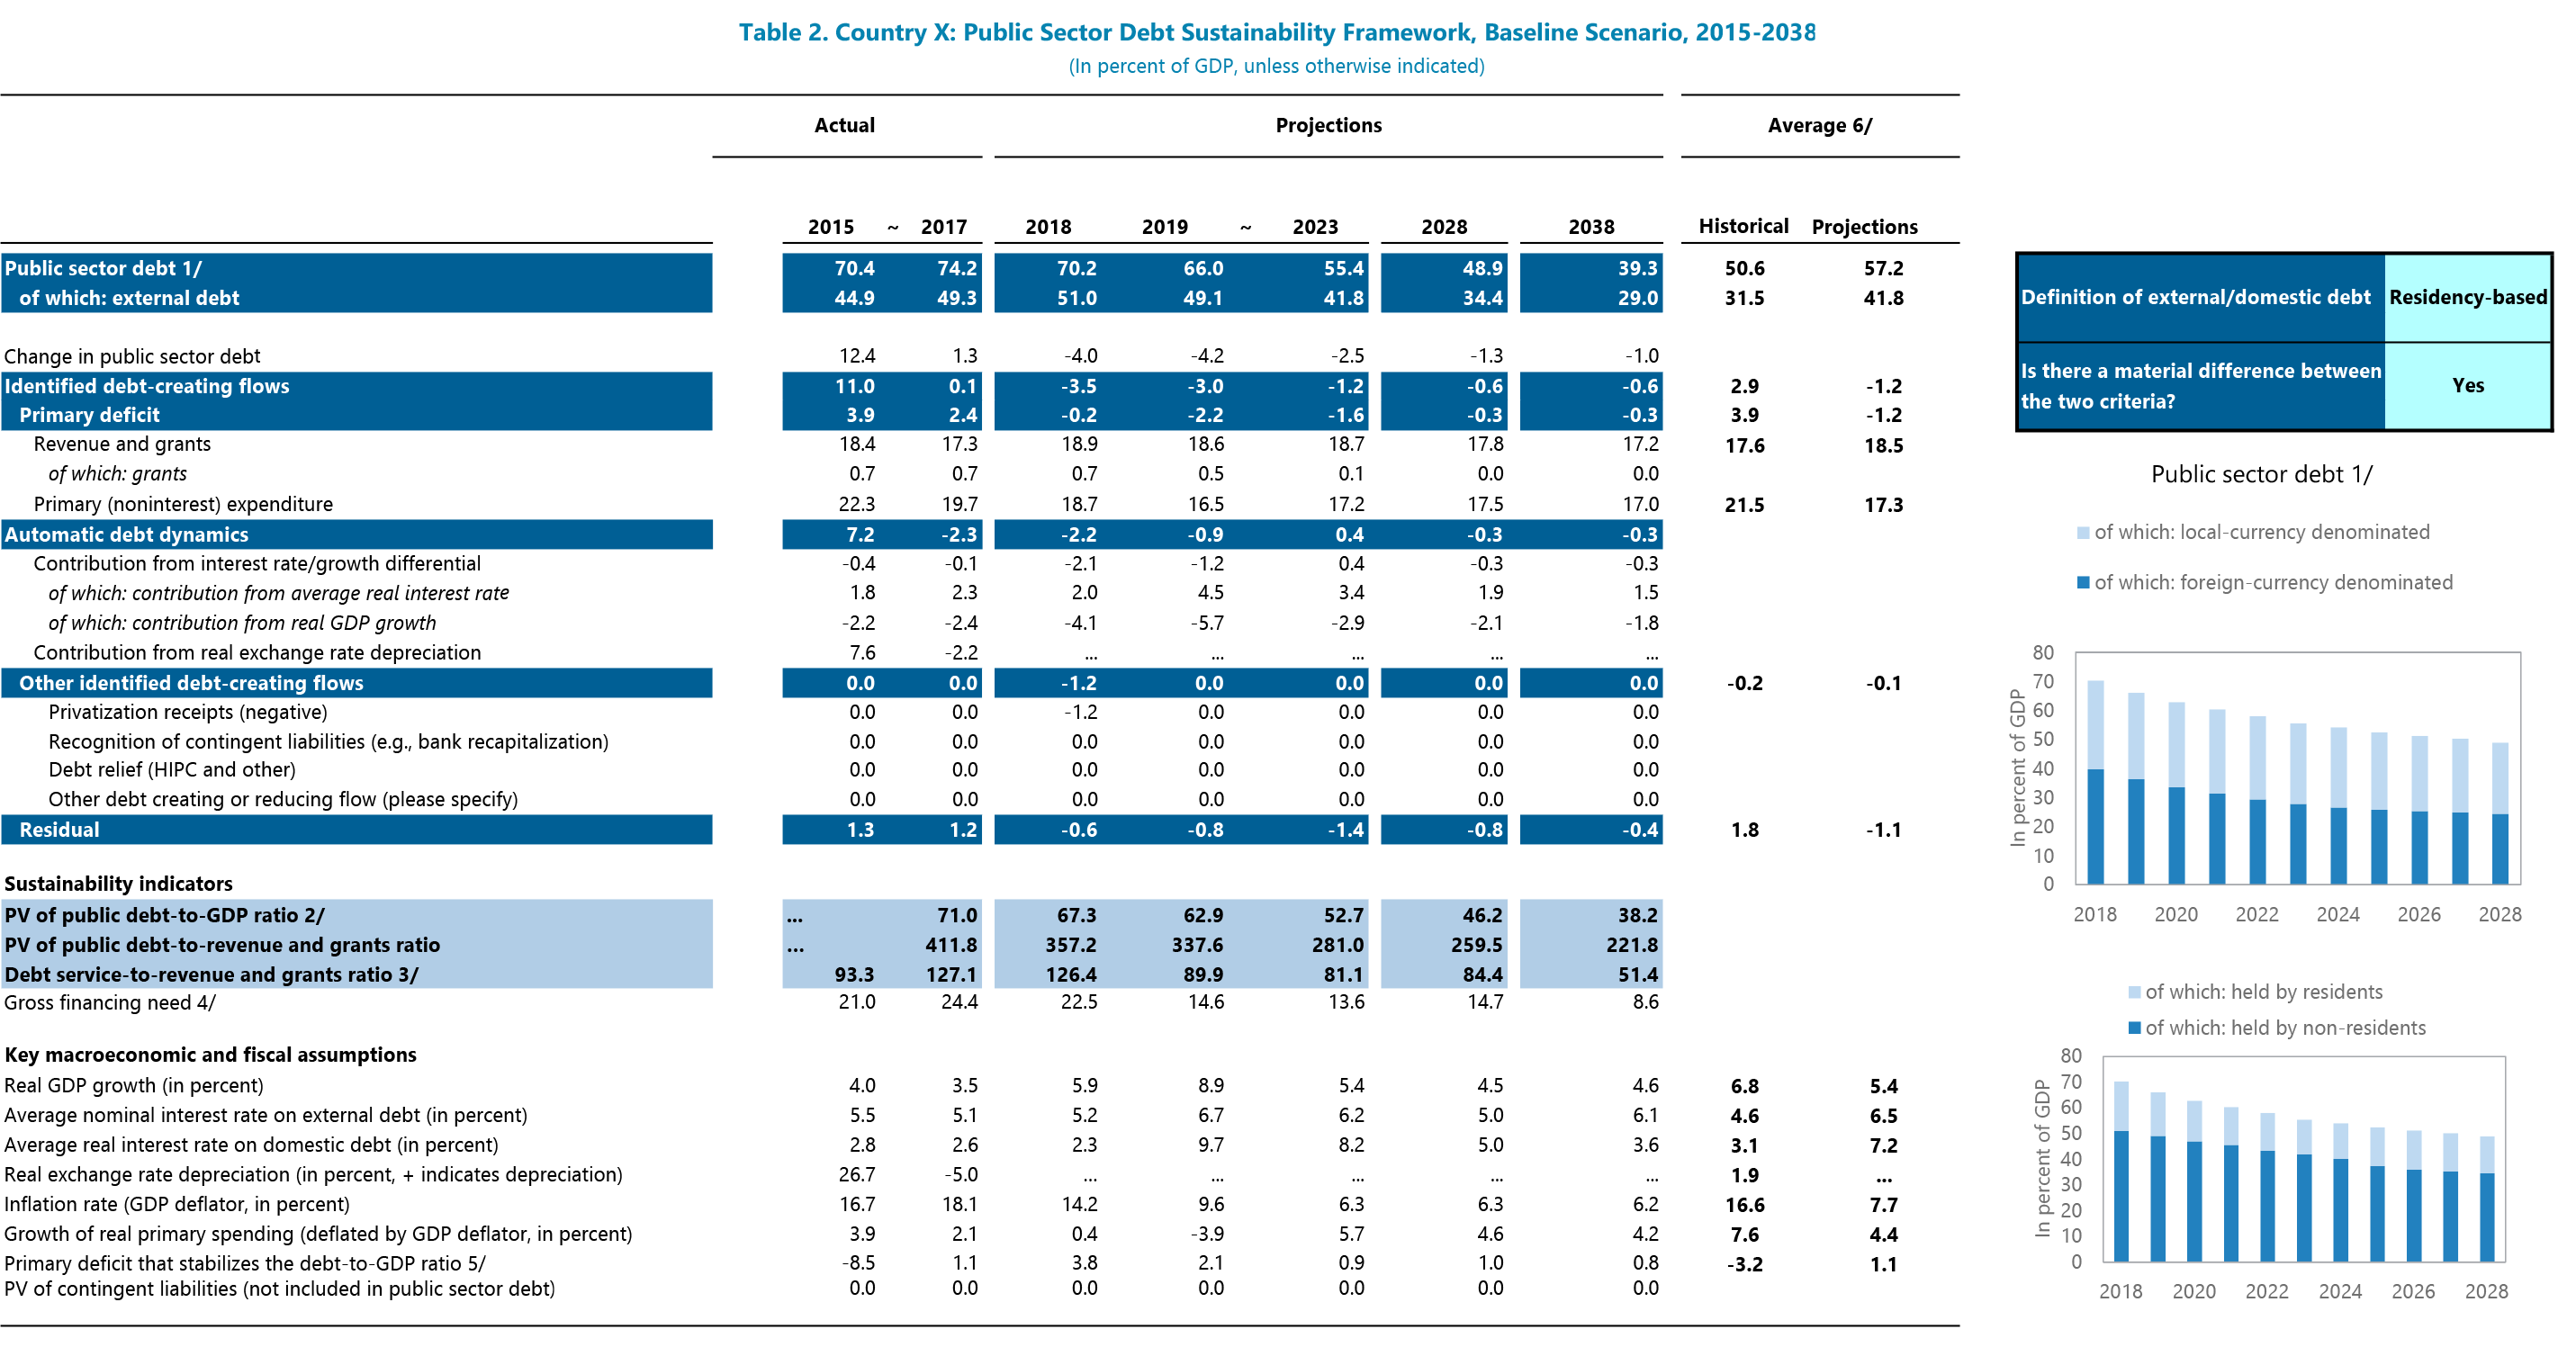
The Output 1-2 - Public DSA sheet displays information under the baseline scenario of the Public DSA.
 Key Messages
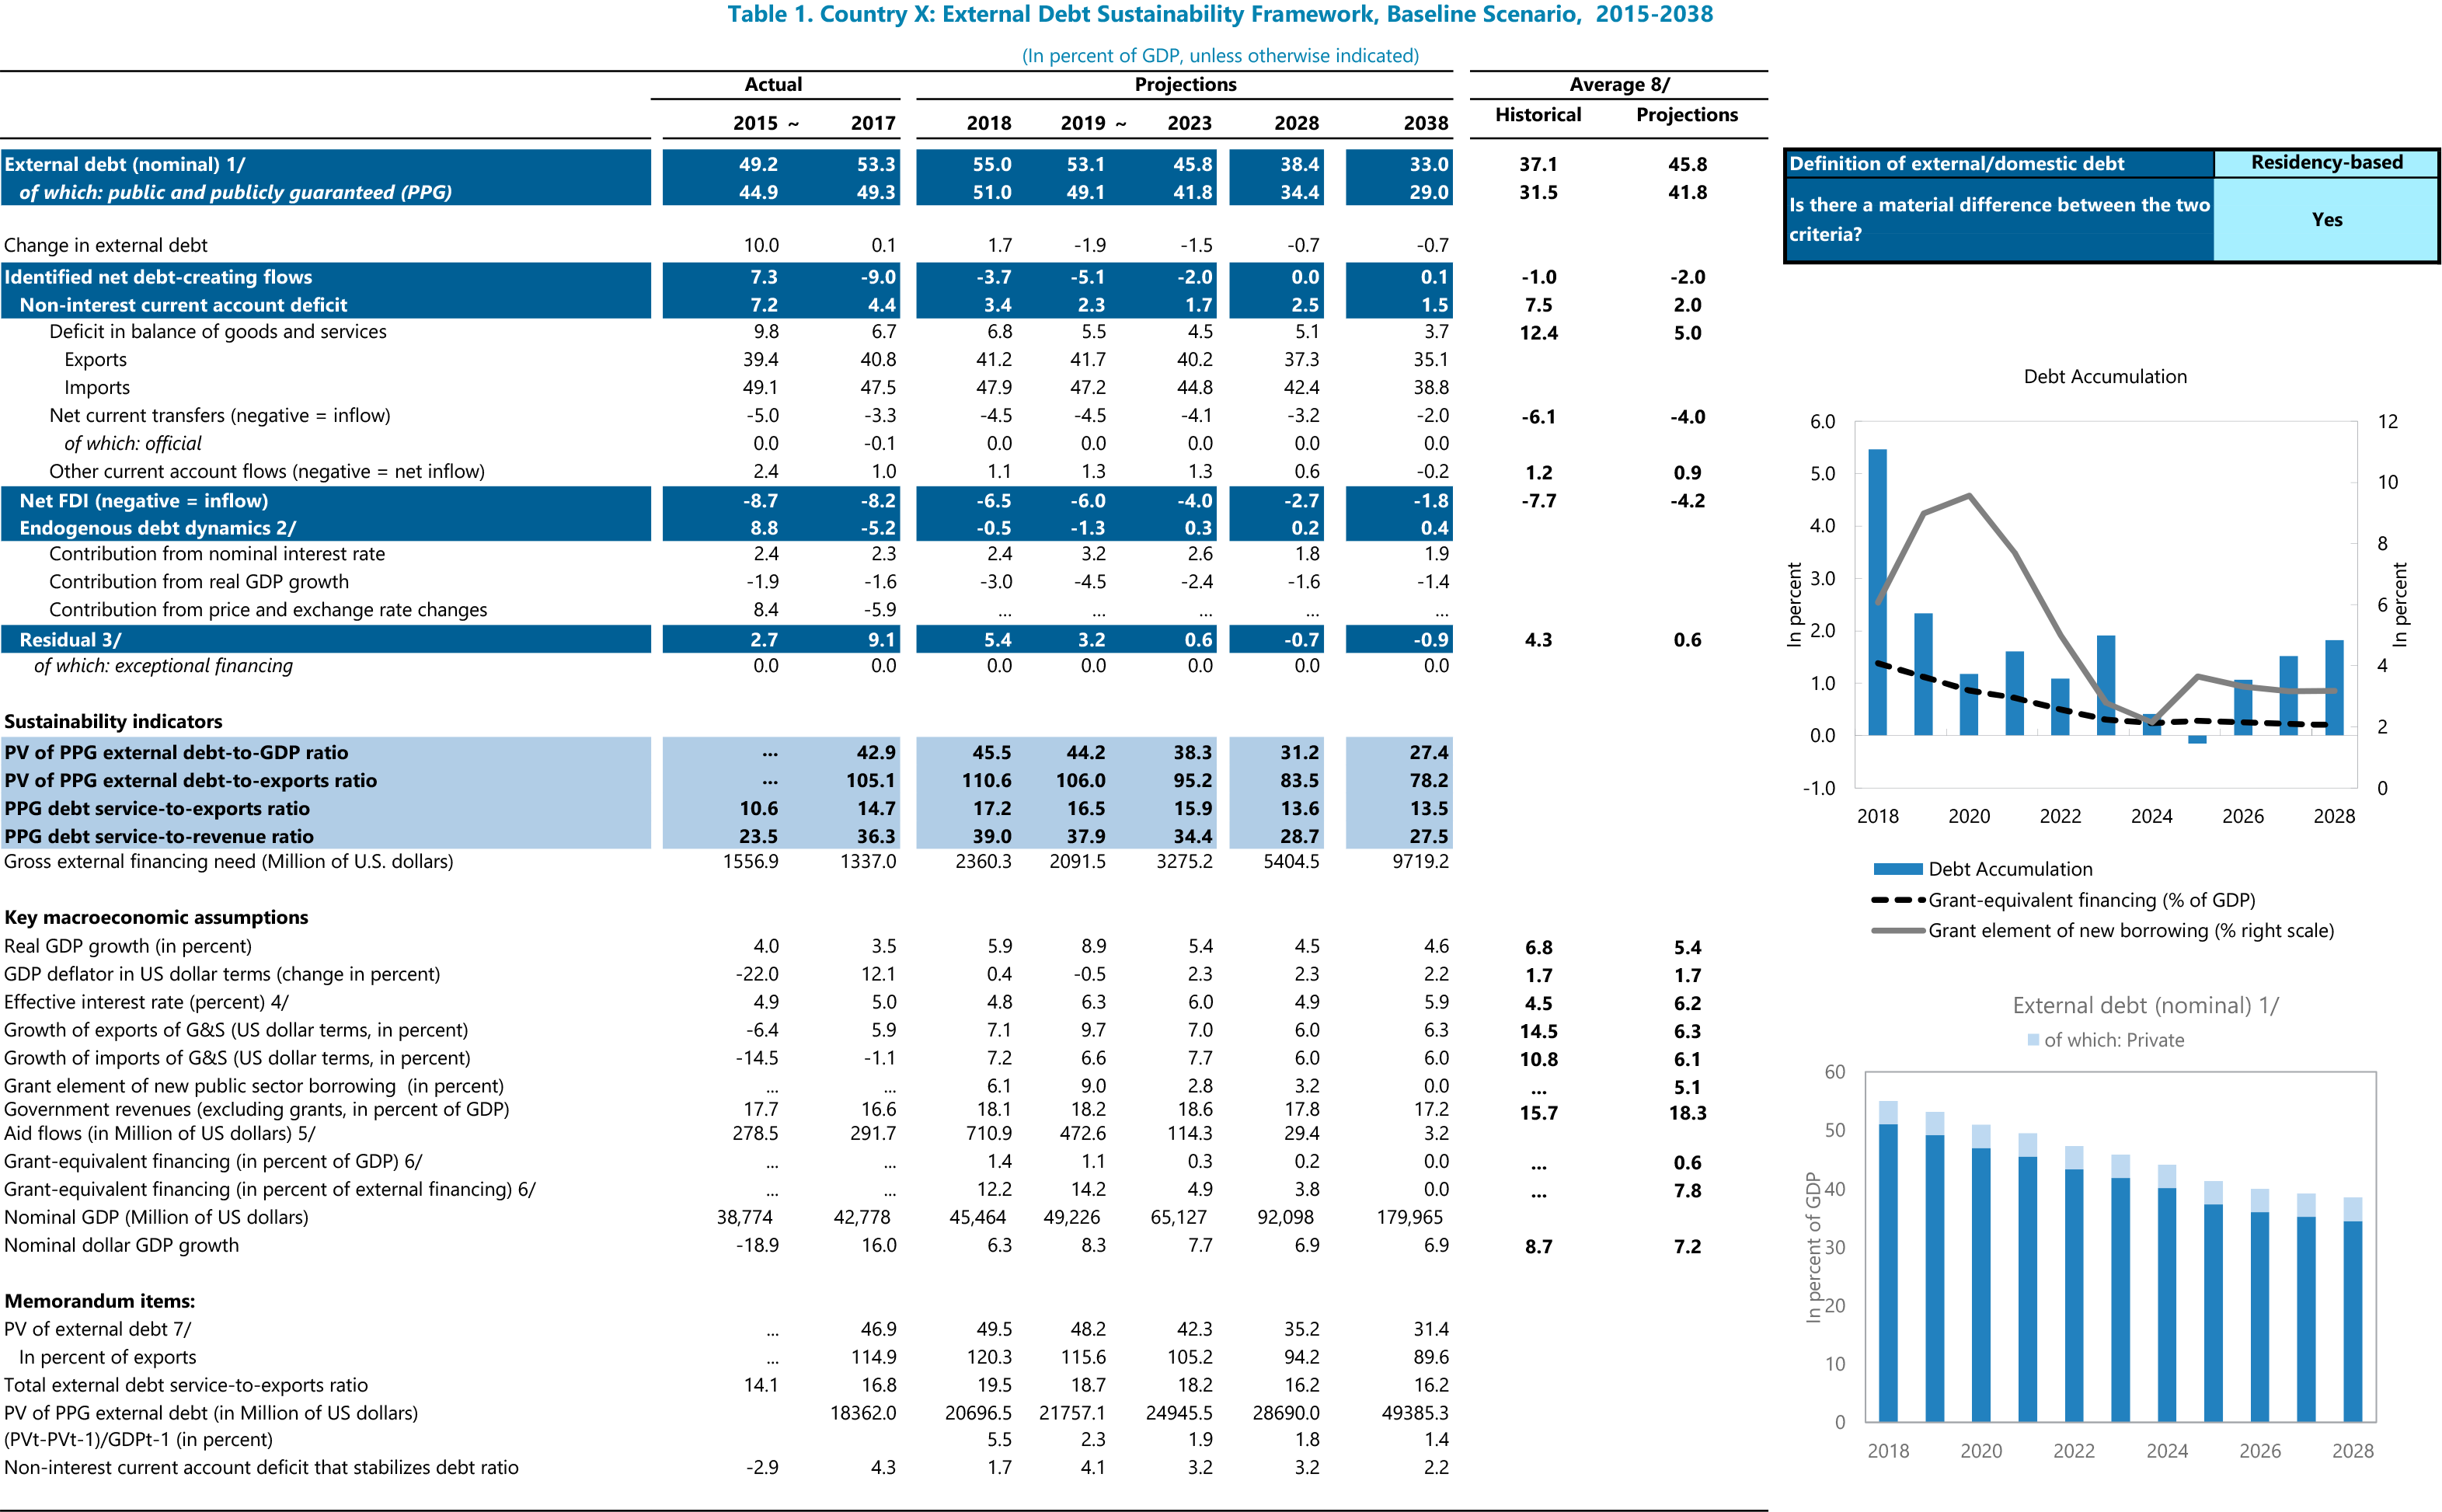
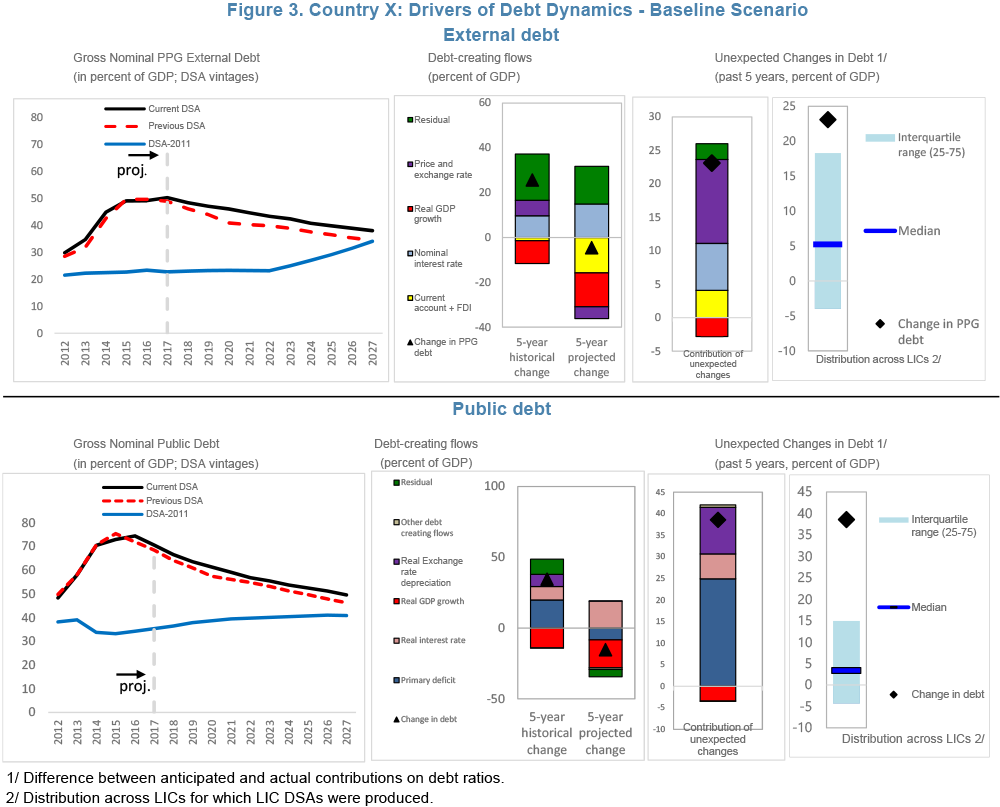
- Baseline projections for external and public DSAs are summarized in the respective External and Public Output 1 tables.
- For an external DSA, the output table summarizes the projections of the external debt-to-GDP ratios. It also decomposes its projected evolution (change in debt) into the main drivers of external debt dynamics: identified debt-creating flows less net FDI plus endogenous debt dynamics plus residual.
- For a public DSA, the output table summarizes the projections of the public debt-to-GDP ratios. It also decomposes its projected evolution into the main drivers of public debt dynamics: identified debt-creating flows plus automatic debt dynamics plus other flows plus residual.
- PPG external debt is part of the total external debt as well as part of the total public debt.
Nominal Public Debt
This shows the evolution of the nominal public debt. Note, these are not the values that inform the mechanical risk signal. The risk signal is based on the PV of debt to GDP ration below.
Identified Debt-Creating Flows
The decomposition of debt evolution into its driving factors based on public debt dynamics equation are displayed.
Debt Burden Indicators
The three debt ratios are shown, although only the PV of public debt to GDP is an input (along with the four external debt burden indicators) used to inform the overall public debt risk signal. These values are plotted as the blue line in "Output 2-2 Stress_Charts_Pub" sheet.
PV of Public Debt
The PV of public debt is calculated as the sum of the PV of external public debt plus the nominal value of public domestic debt.
Key Macroeconomic Assumptions
Key underlying macroeconomic assumptions are displayed.
Definitions of External and Domestic Debt
The definition of external and domestic debt is displayed here. This is based on the user input in "Input 1 - Basics" sheet.
Public Sector Debt Breakdown
This displays the breakdown of the Public Sector Debt by local and foreign currencies.
Residency-Based DSAs
If the DSA is residency-based, the breakdown of public sector debt held by residents and non-residents are displayed. If the DSA is currency based, this table will not be applicable.
Output 2-2 
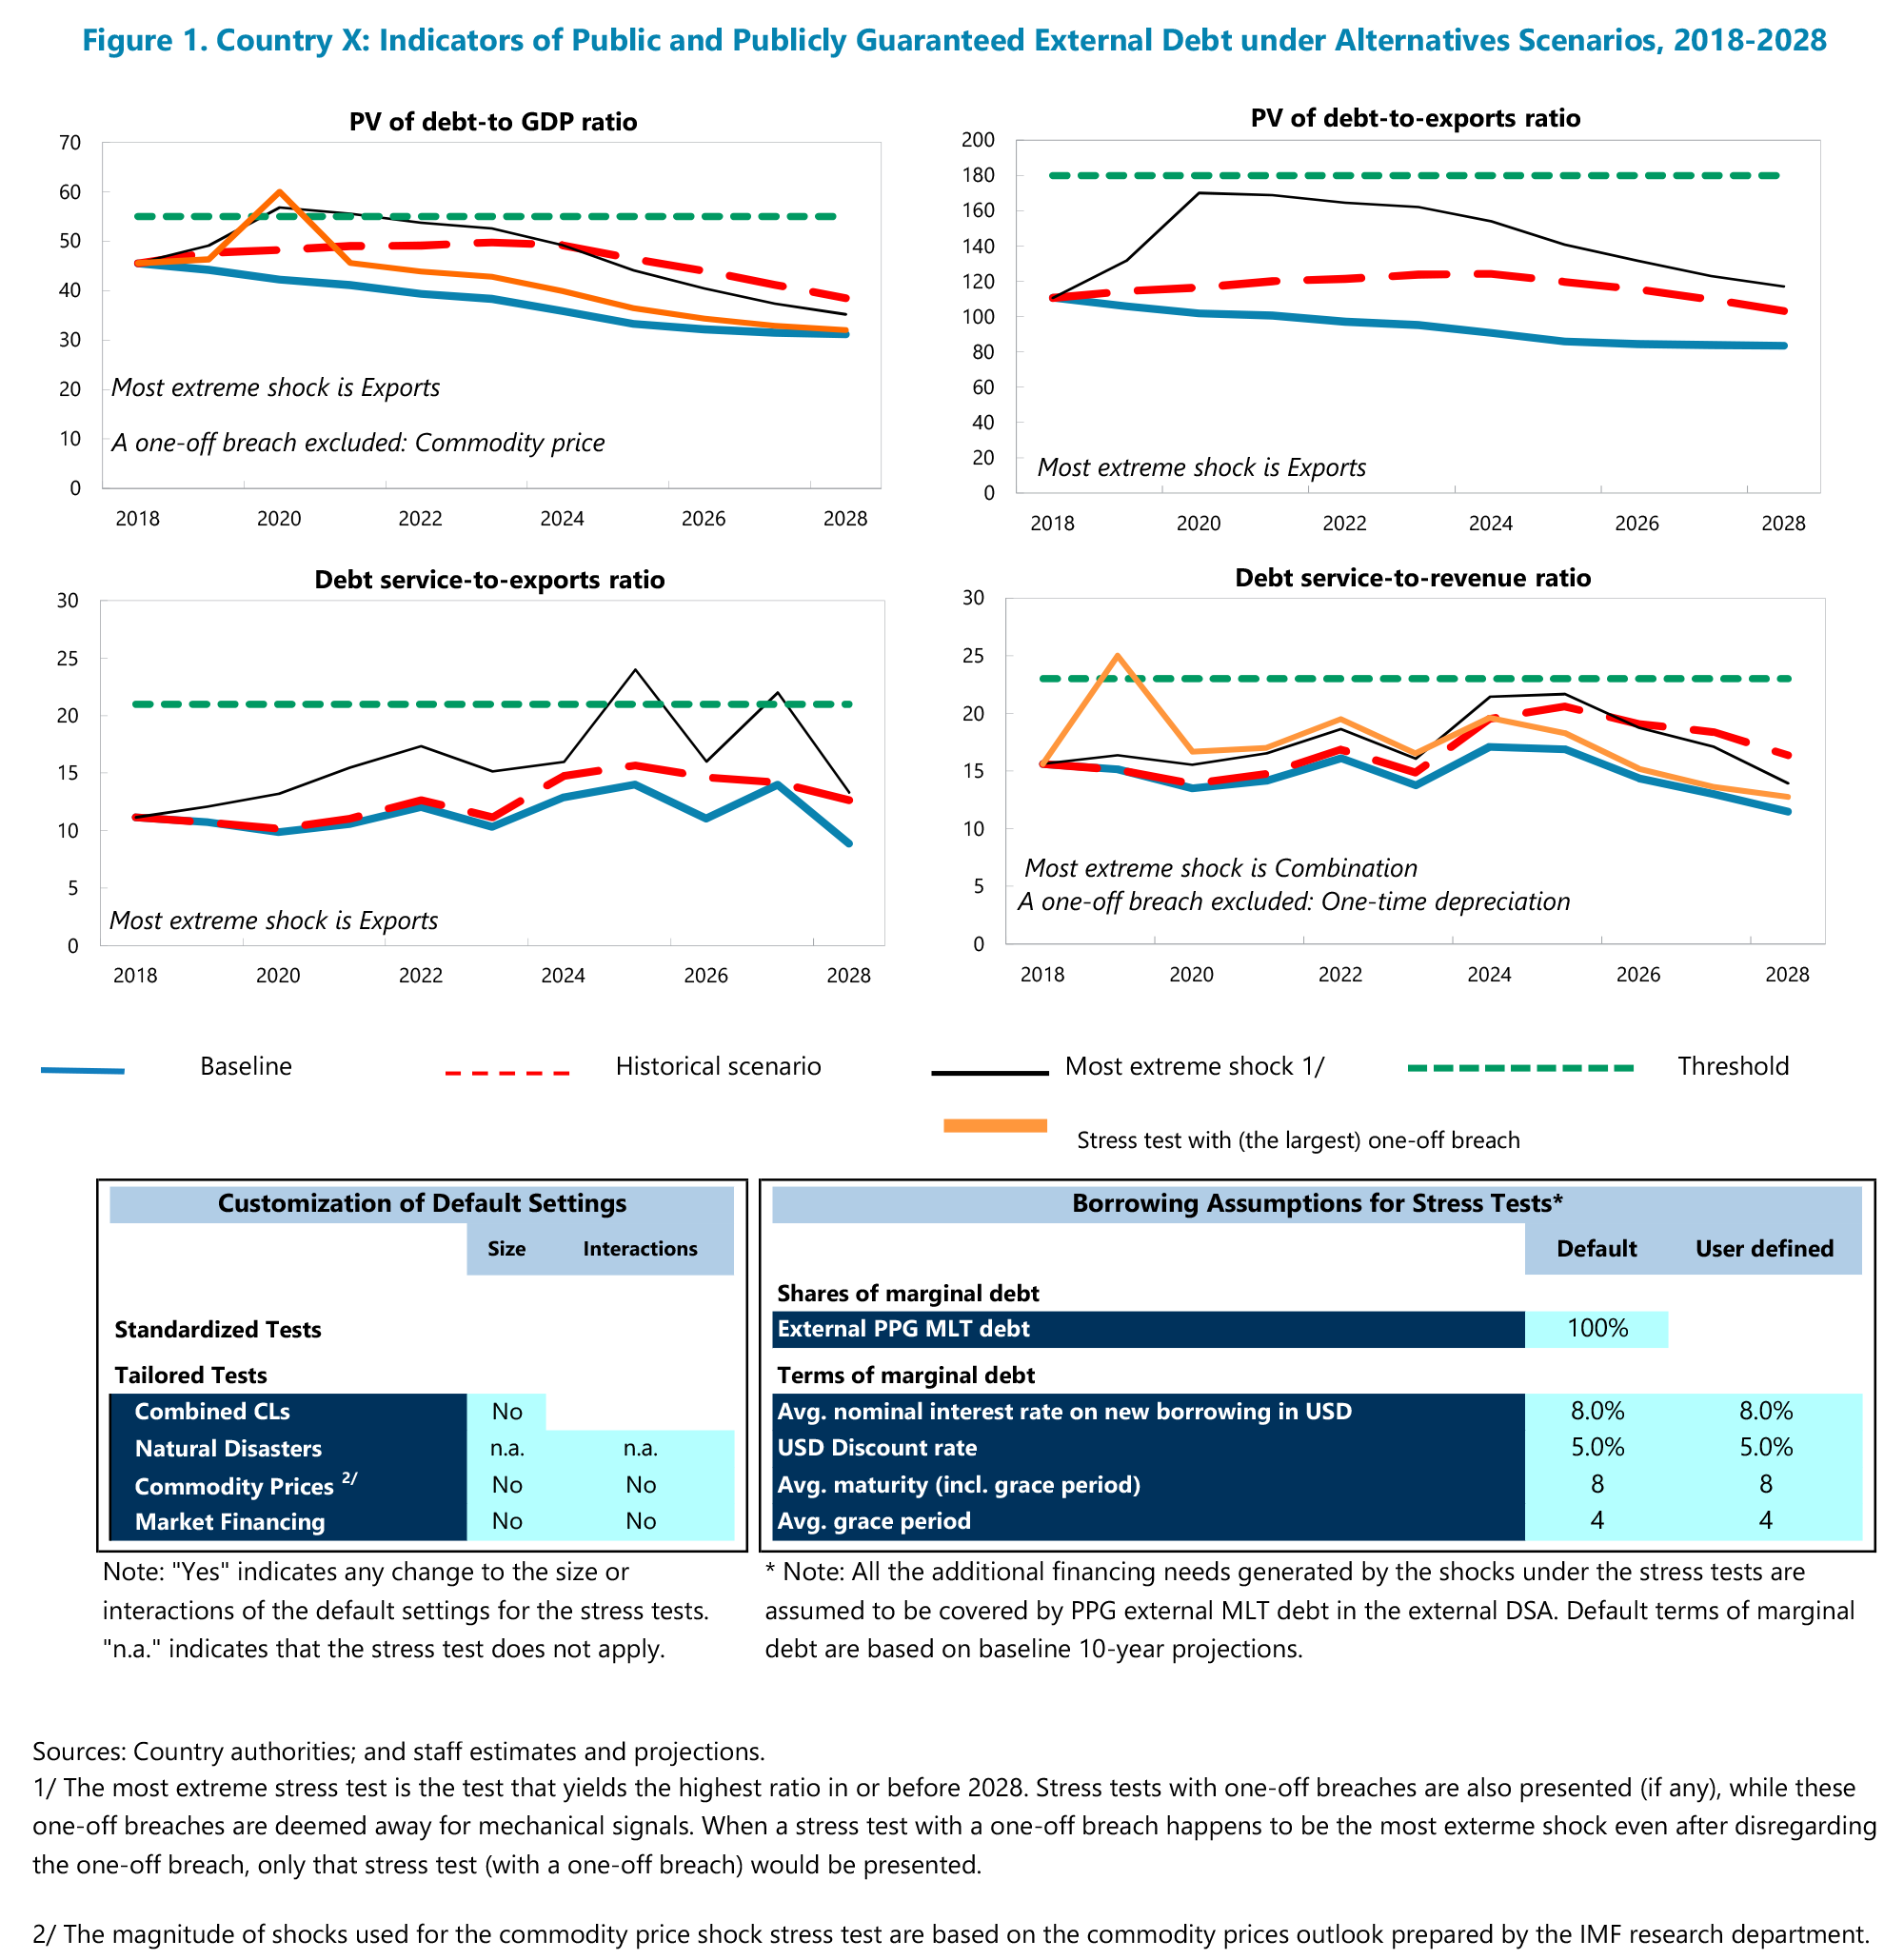
Green Dash Line
The green dash line is the threshold.
Solid Black Line
The most extreme stress test is represented by the solid black line.
This test yields the highest debt ratio within the first 10 years of projections under the whole set of tests, and includes both standardized and tailored
tests but excludes customized scenarios, if any.
Red Dotted Line
The historical scenario is represented by the dotted red line.
It helps to validate the underlying macroeconomic and financial assumptions of the baseline, but does not inform the risk rating.
Text Entry
The most extreme stress test is also noted. The text entry indicates which of the shock is the most extreme, which underlies the black line.
Solid Blue Line
The solid blue line represents the baseline scenario.
Solid Orange Line
The orange line shows a stress test that has a one-off breach. The corresponding shock is also displayed in text under the heading "A one-off breach excluded". This breach is automatically deemed away for the mechanical risk rating. It is displayed in the chart so you can assess if it warrants additional scrutiny. Please see Station 8 for further explanation.
Customization of Default Settings
Any customization of the stress test default settings (Input 6 sheets) will appear here.
Borrowing Assumptions
Based on the disbursements in the baseline projected, the average terms are calculated and applied to any residual (additional) financing needed under the stress tests.
Output 2-2
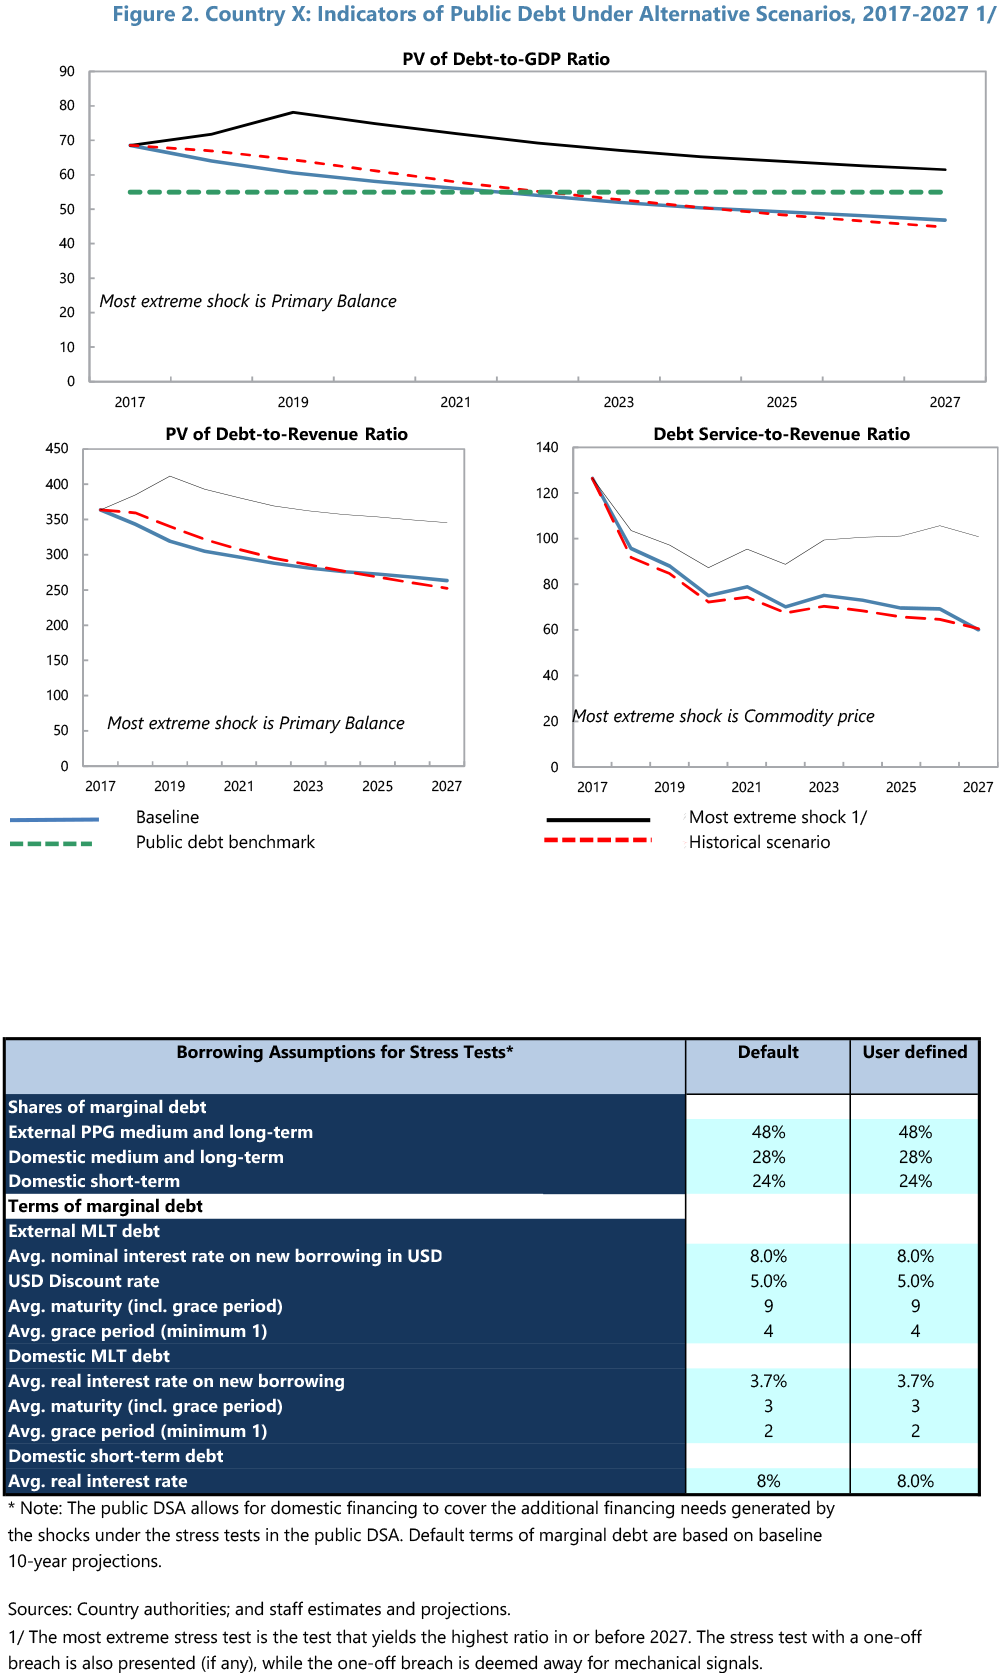
This sheet shows relevant debt indicators for PPG total public debt in the baseline (a solid blue line), the historical scenario (a dotted red line), and the most extreme stress test (a solid black line and in the text entry). The most extreme stress test yields the highest debt ratio within the first 10 years of projections under the whole set of tests, including the standardized and tailored test but excluding customized scenarios, if any. The historical scenario helps to validate the underlying macroeconomic and financial assumptions of the baseline but does not inform the risk rating.
Borrowing Assumptions for Stress Tests
Similar to the external DSA, the public DSA displays the assumptions applied to any residual (additional) financing needed under the stress tests. The default values are based on the disbursements in the projected baseline.
Output 3. External and Public Stress Tests Tables
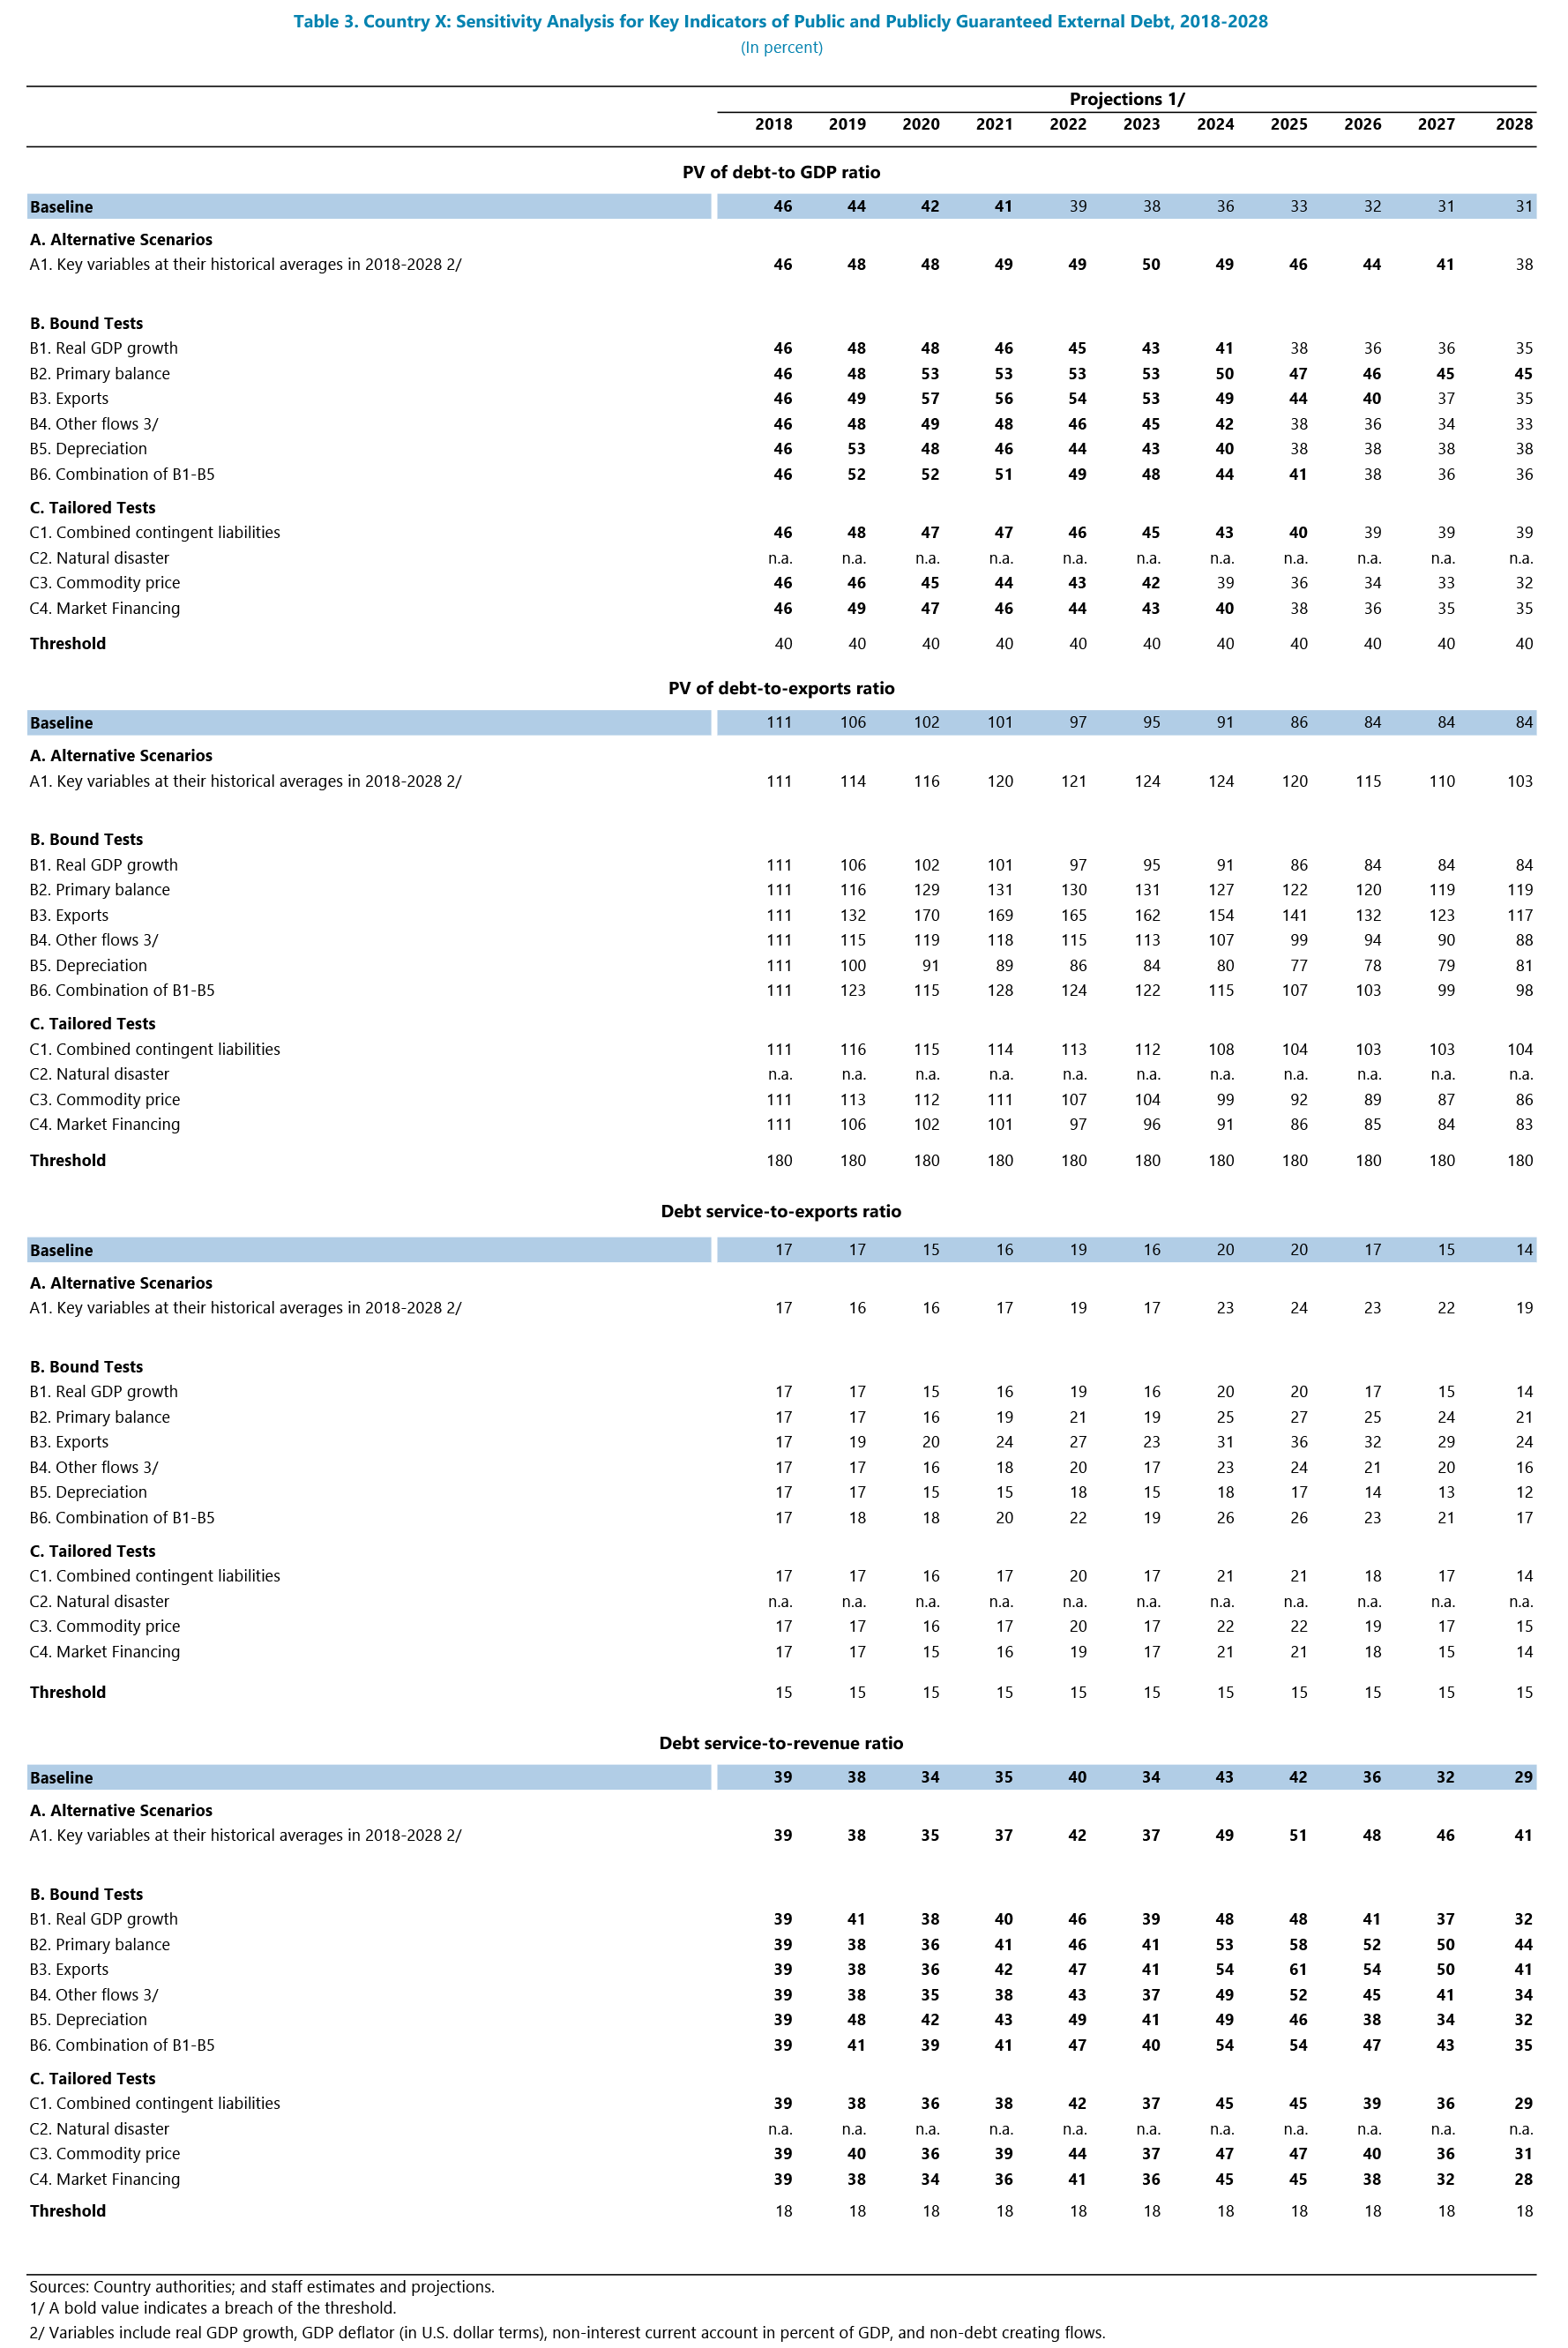
The "Output 3-1 Stress-External" sheet displays the values of the debt burden indicators under the external DSA under the baseline, the historical scenario, and each of the stress test scenarios. The thresholds are also shown.
Bold Text
If text is bold it indicates a breach of the threshold.
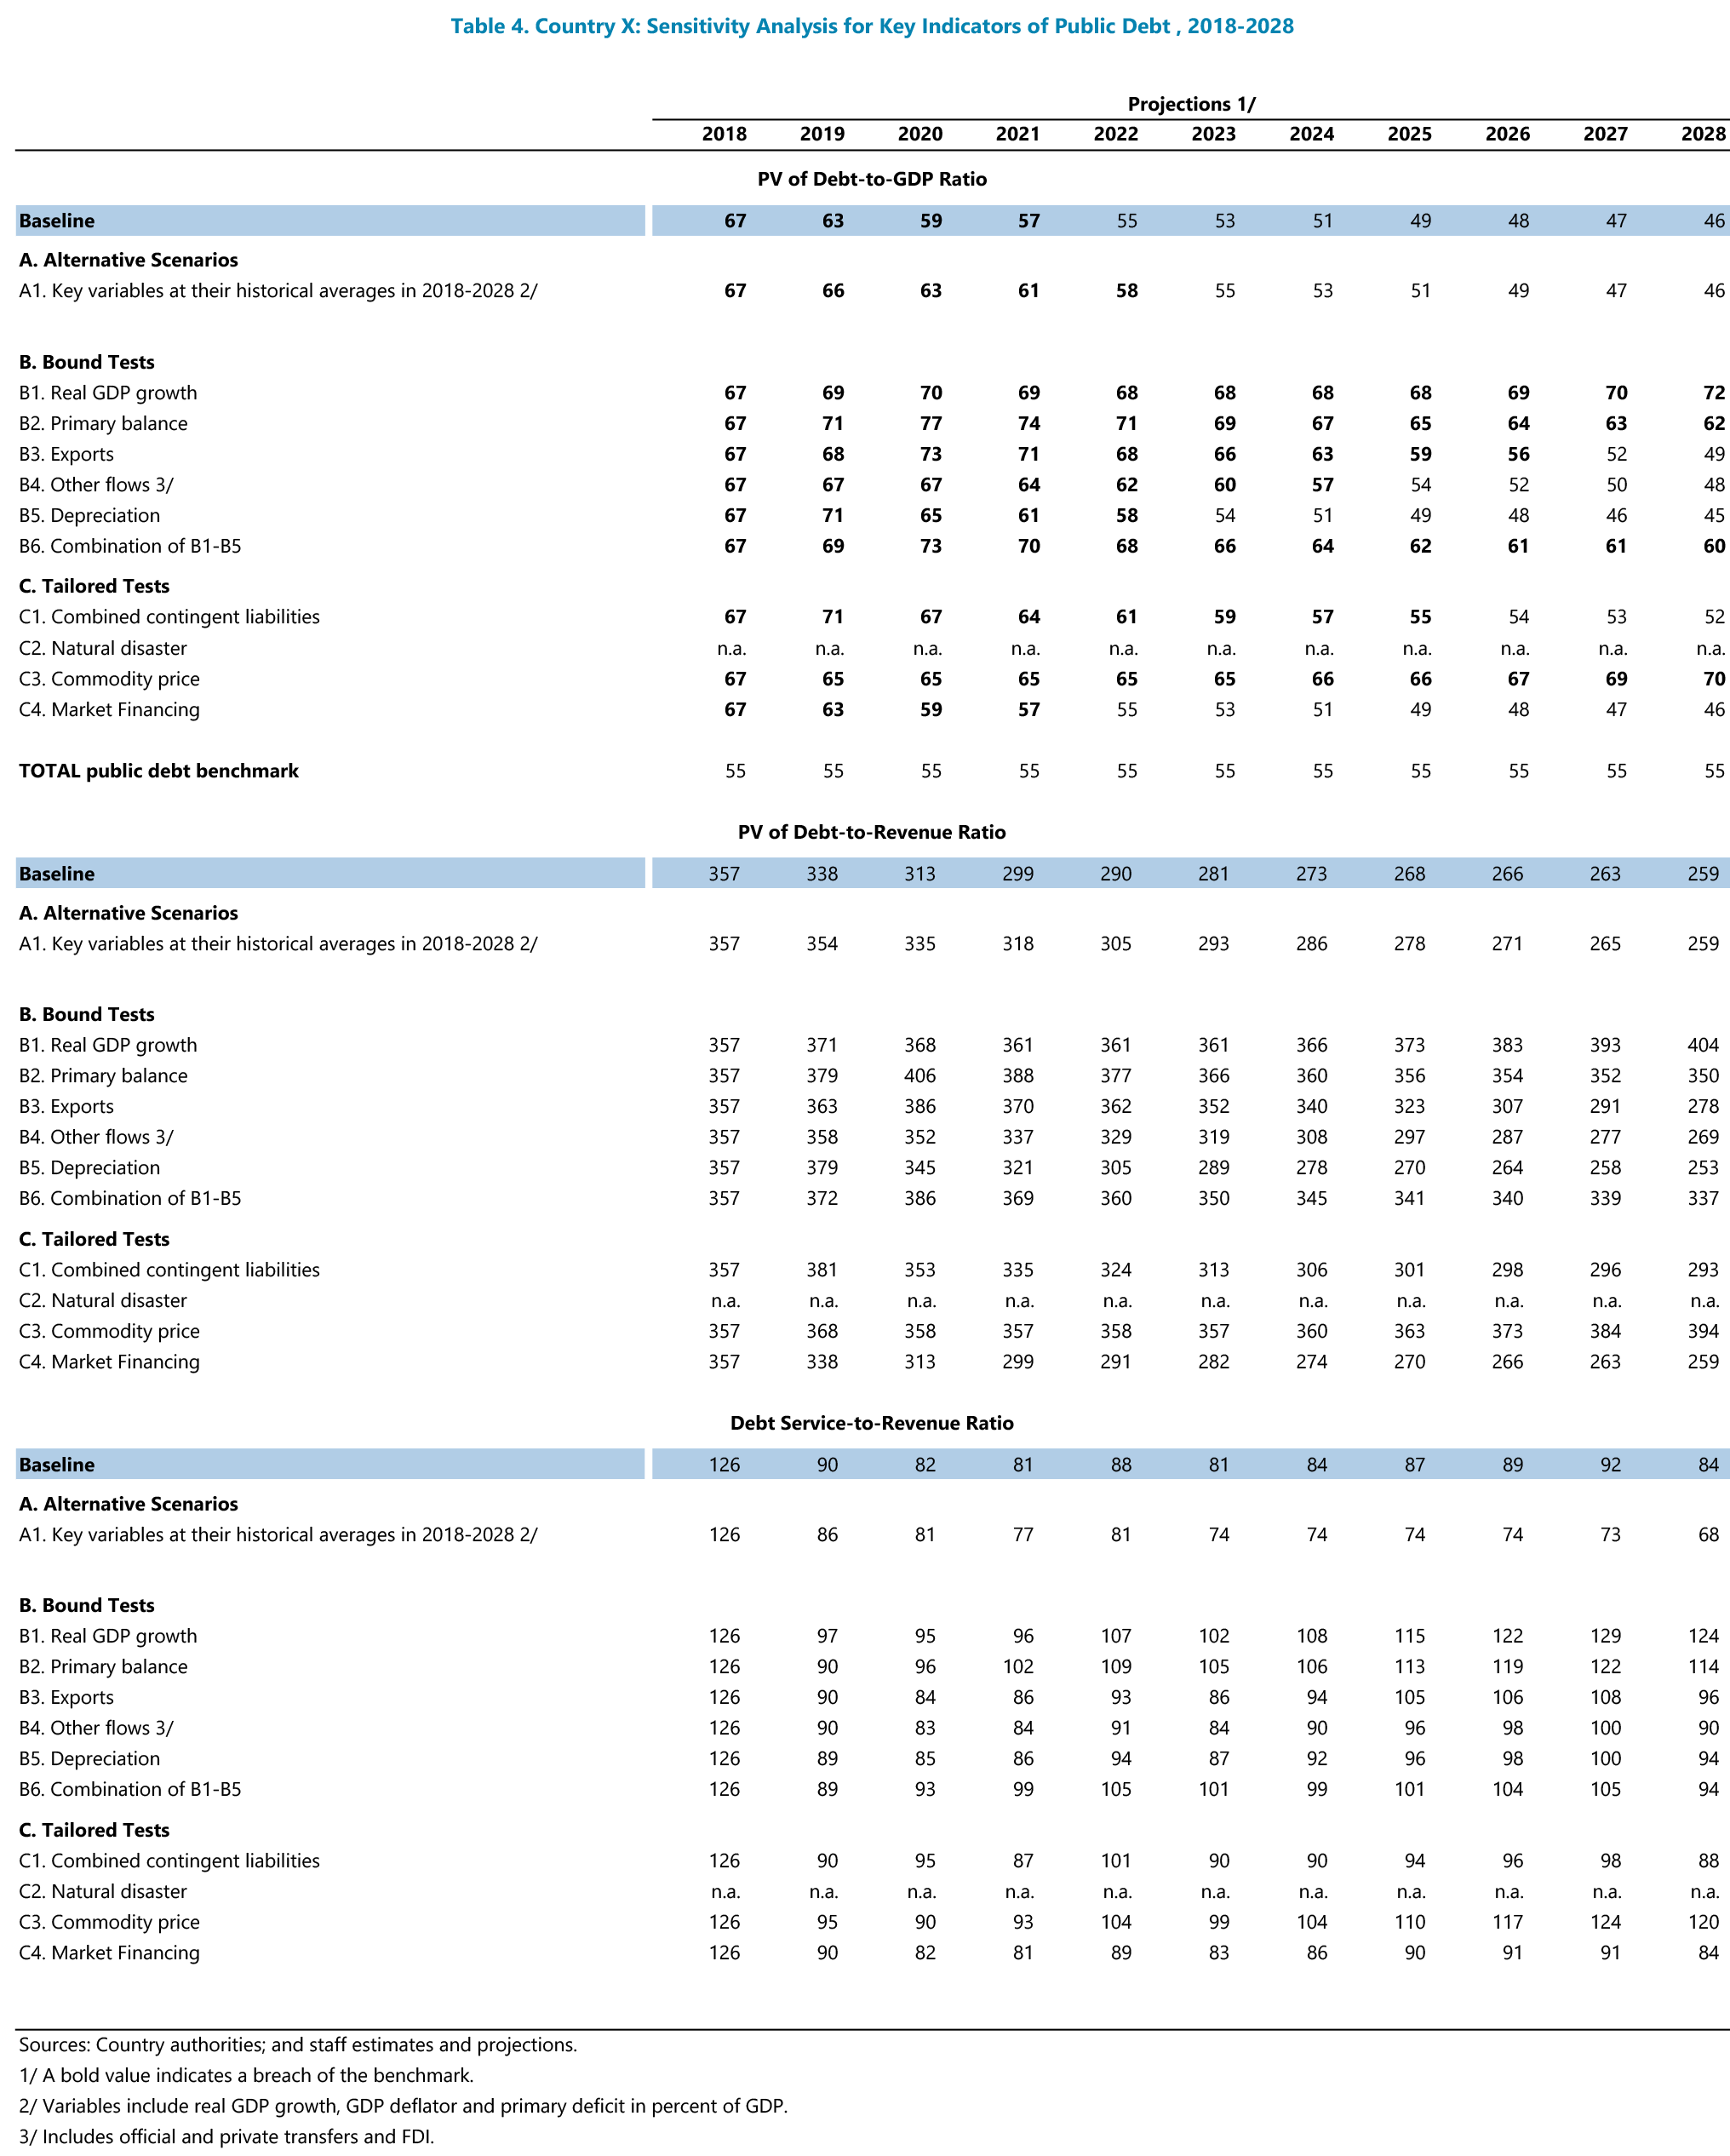
"n.a."
If the stress test is not applicable to the country, "n.a." will be displayed.
Bold Text
If text is bold it indicates a breach of the benchmark.
The "Output 3-2 Stress-Public" sheet displays the values of the debt burden indicators under the public DSA. Like in the external DSA table above, the baseline, the historical scenario, each of the stress test scenarios, and the thresholds are shown.
 Key Messages
- The projections of the key ratios for PPG external debt and public debt are plotted against their respective external debt thresholds and public debt benchmark (presented in Station 4). The respective output tables summarize the evolution of the ratios under the stress scenarios.
- The charts show the breaches under the baseline, if any, and the stress scenarios, which in turn determine the mechanical risk ratings under both the external and public DSAs.
Output 4-1 Forecast Error Sheet
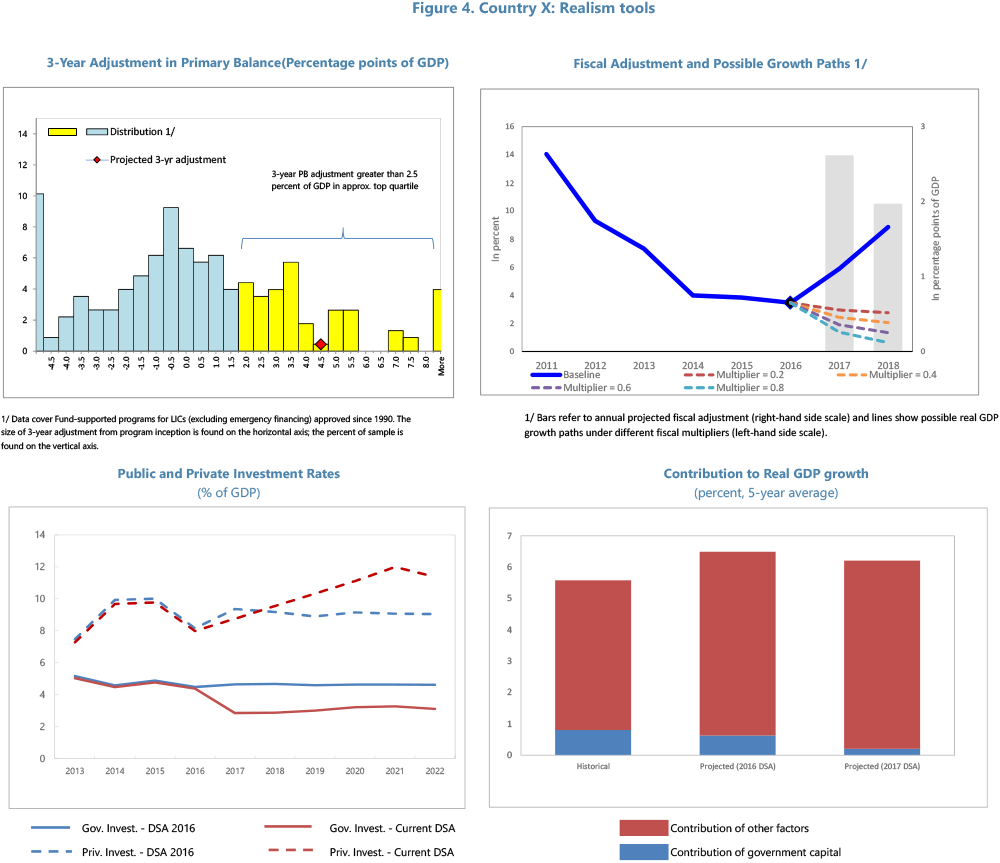
The outputs of the realism tools from Station 3 are also included as part of the outputs of the LIC DSF template.
The "Output 4-2 - Realism" sheet also displays the outputs of the realism tools discussed in Station 3. This output is to be included in the report.
 Key Messages
- The realism tools from Station 3 summarize the realism of the baseline macroeconomic and debt projections by comparing the projected evolution of debt and its underlying drivers to the historical outcome.
- The realism of the projected fiscal adjustment is evaluated relative to the historical data base of the past fiscal adjustments in LICs and with respect to the implied fiscal multiplier (i.e., the assumed impact of the projected fiscal adjustment on growth).
Output 4-2 Realism Tools Sheet
The output of the realism tools from Station 3 is also included as part of the outputs of the LIC DSF template.

Risk Rating & Other Outputs
The charts below are included in this station to show the complete set of outputs of the LIC DSF. The contents of the charts will be discussed in detail in subsequent stations.
Output 5. Moderate Risk and Market Financing Tools
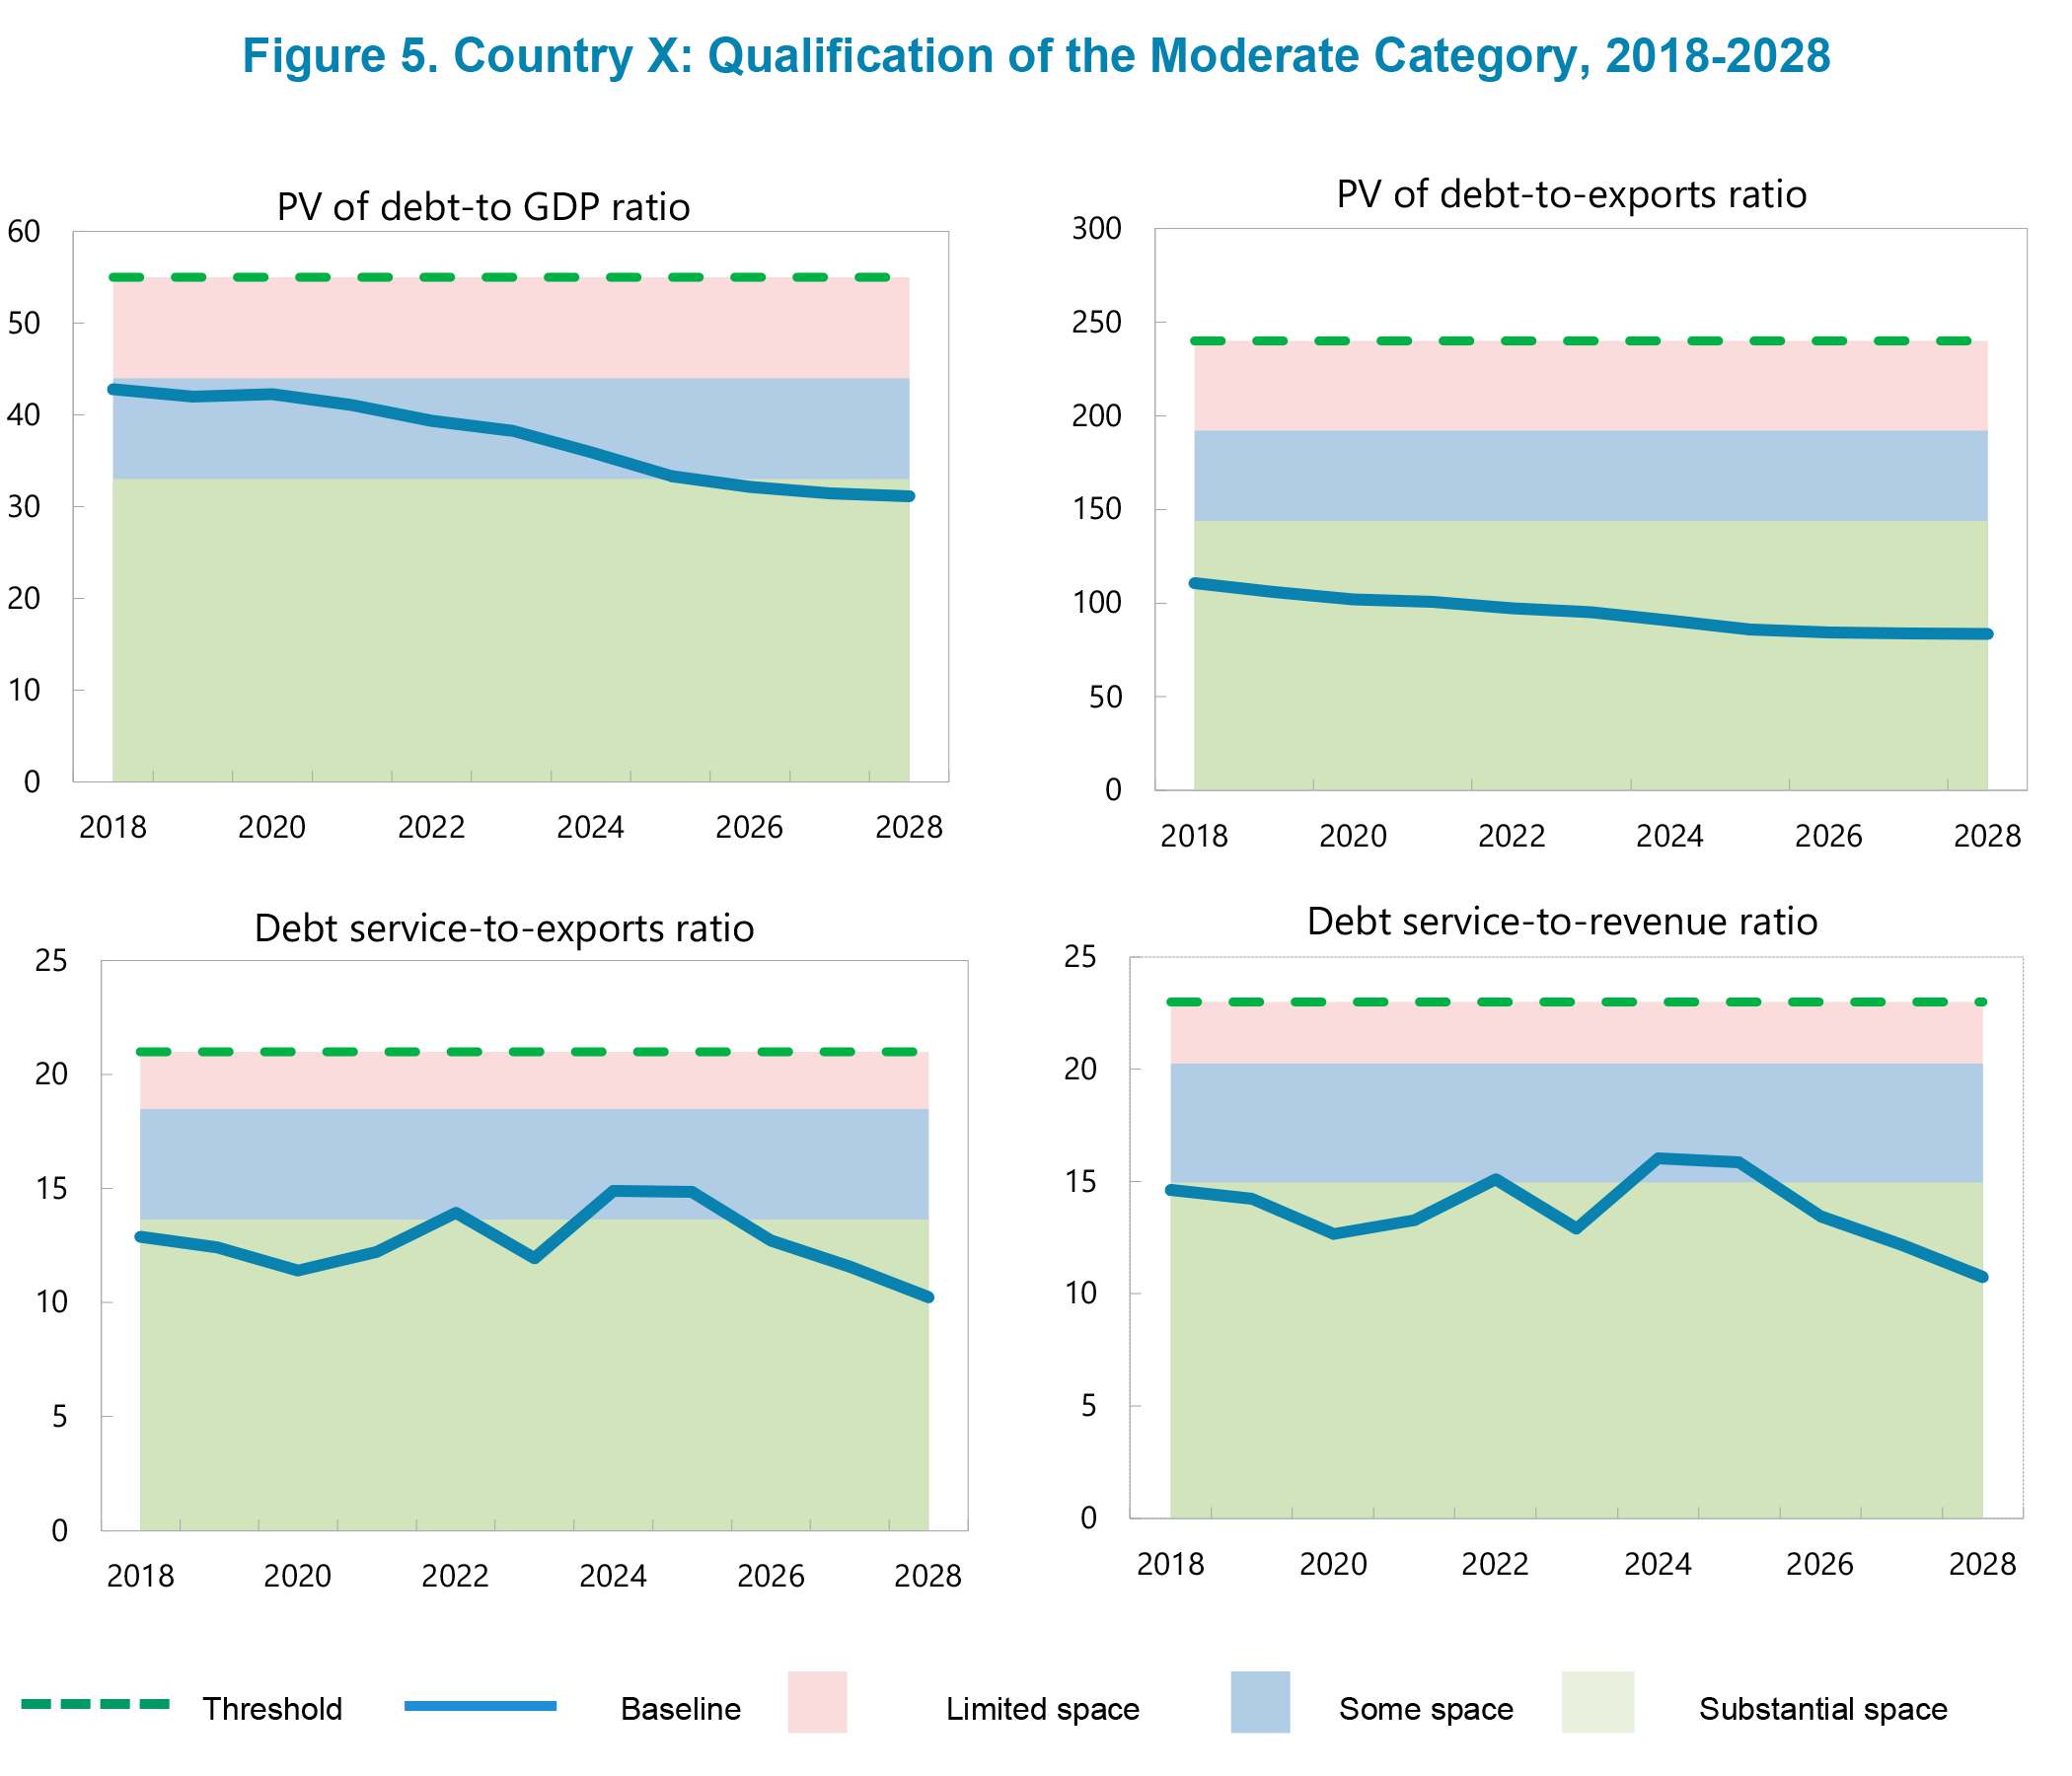
The "Output 5-1 Moderate risk" sheet is only for LICs rated at moderate risk of external debt distress. Please see detailed explanations in Station 9.
Output 5-1 
The "Output 5-2 Market module" sheet shows the results of the market financing tool. This is only relevant for countries with market access. For reference, the panel charts show the external debt burden indicators under the market financing tailored stress test and the baseline scenario. Please see detailed explanations in Station 7.
In the template, this table is in the “Output 5-2” sheet.

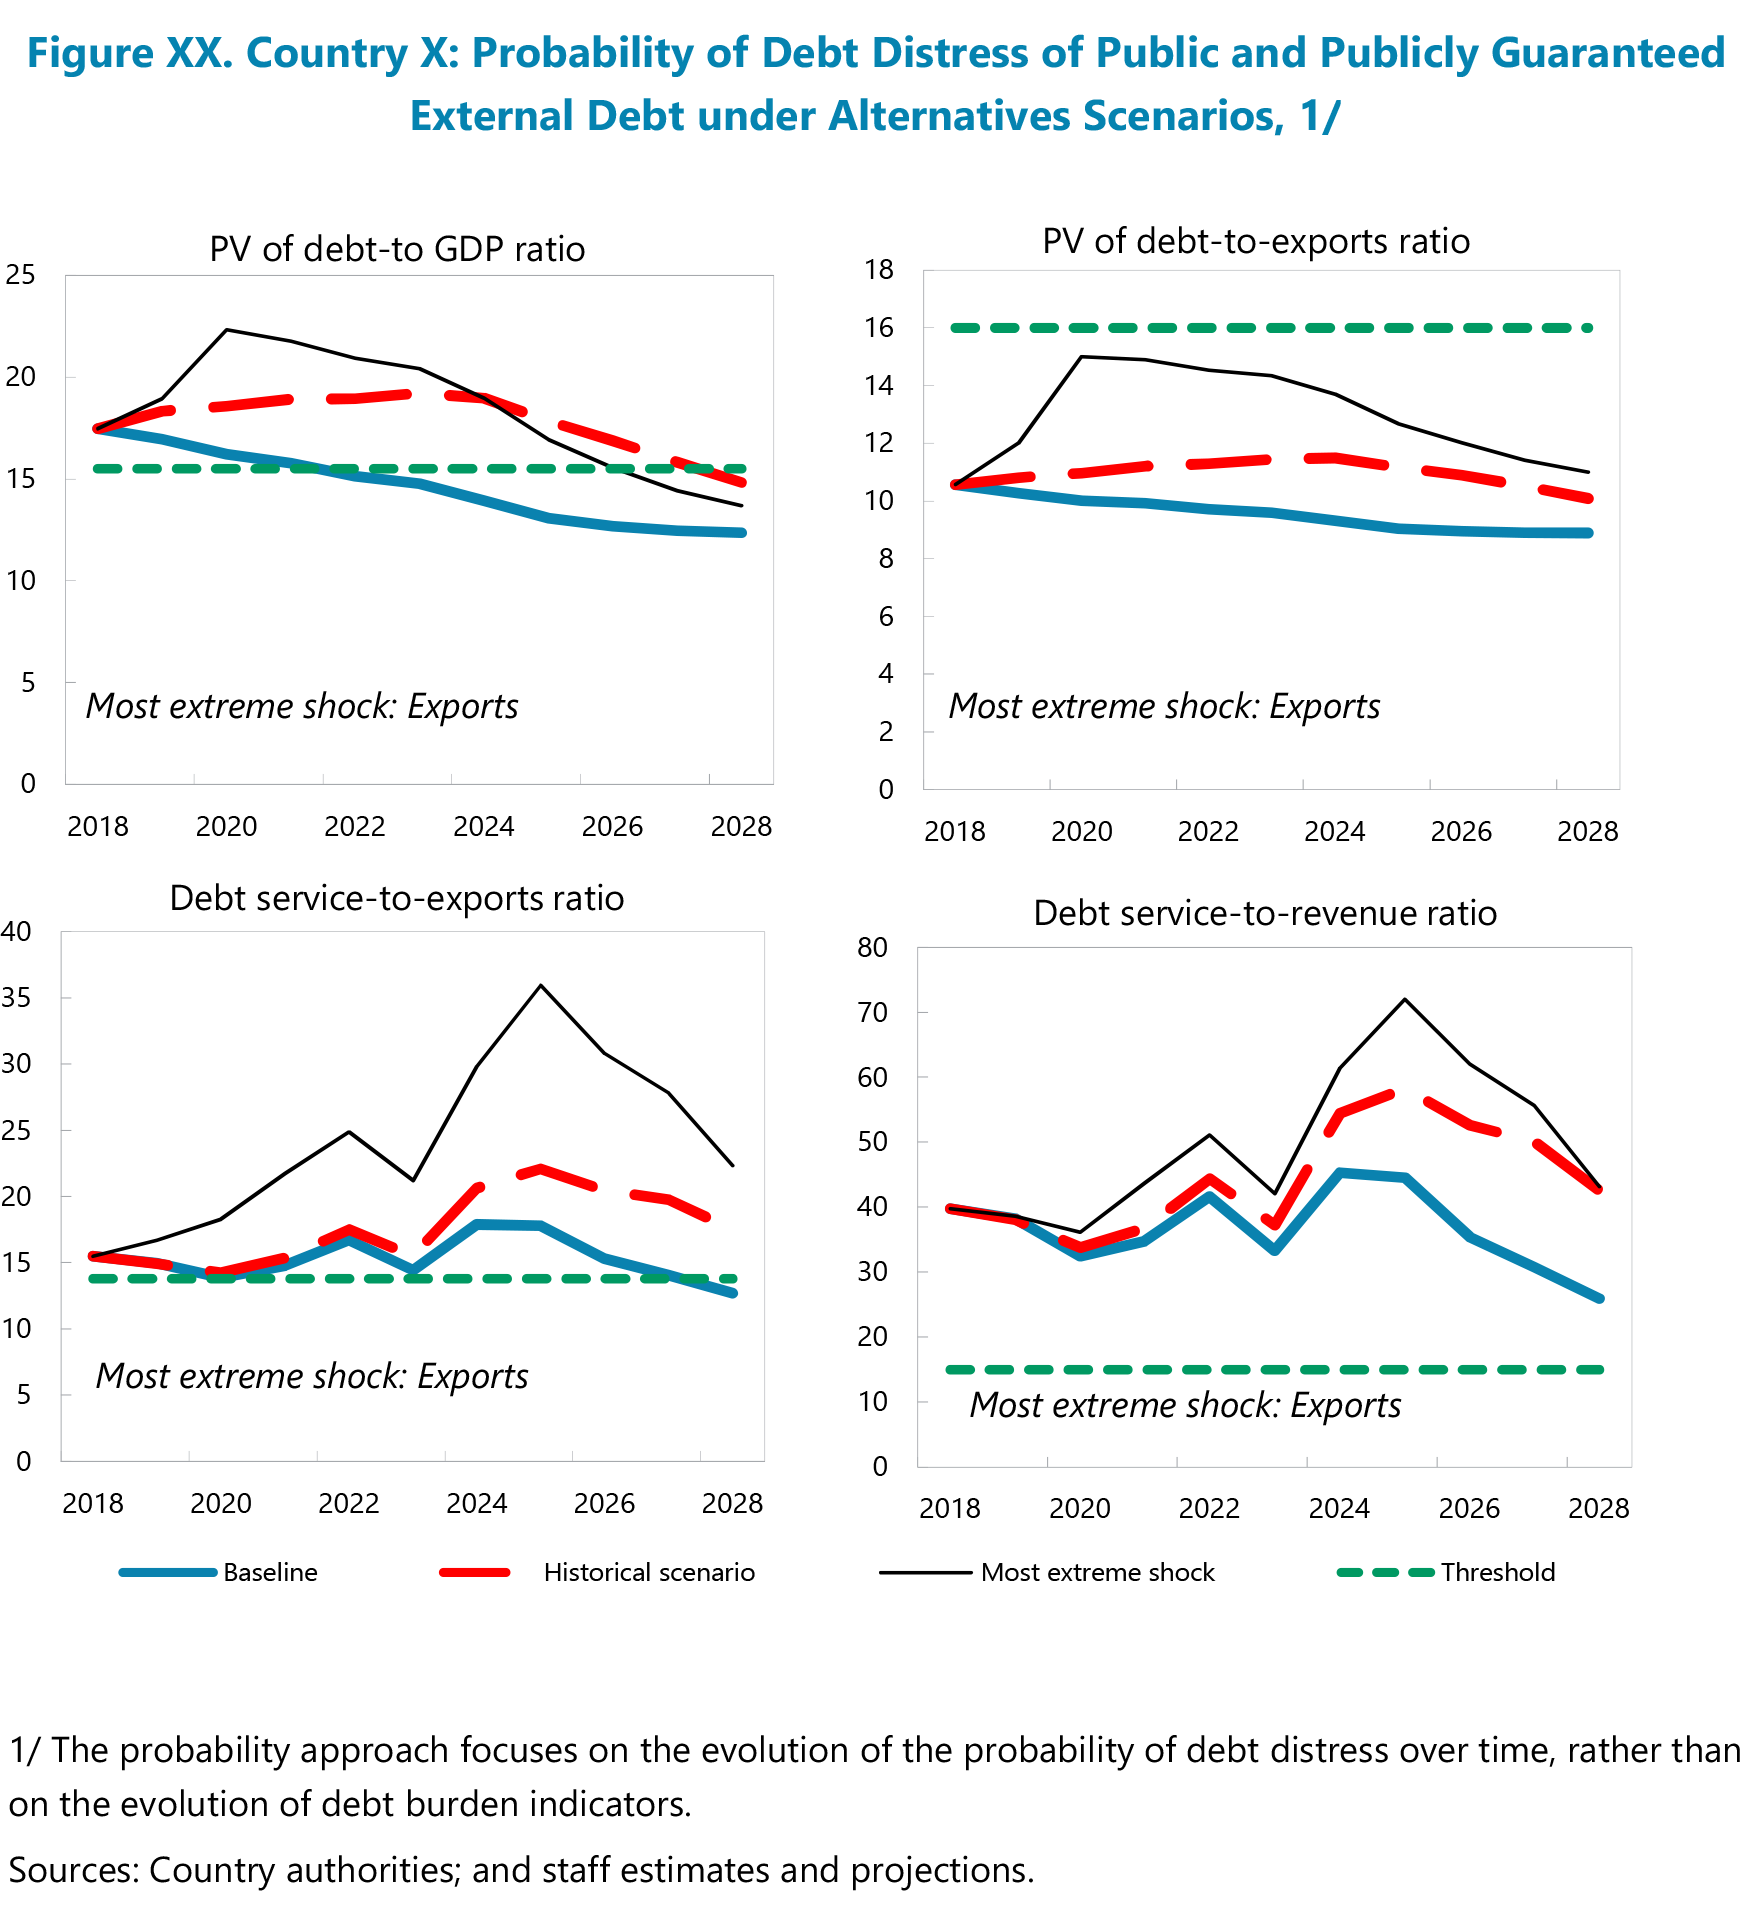
Output 6. Probability Approach
The "Output 6" sheet is optional and only to be included if the probability approach is used.
The probability approach may be used when a country’s risk rating is on the border between two categories under the traditional (threshold) approach. This is meant to enhance a case for assigning the final risk rating after all other factors informing judgement.
In the template, this table is in the “Output 6” sheet.
 Key Messages
- The Moderate Risk and Market-Financing Risk modules, as well as the Probability Approach module, only apply to selected LICs and therefore do NOT inform the mechanical risk ratings.
Output 6 External DSA Panal Charts for the Pobability Approach Sheet
The probability approach may be used when a country’s risk rating is on the border between two categories under the traditional (threshold) approach. This is meant to enhance a case for assigning the final risk rating after all other factors informing judgement.
Output 7. Final Risk Rating
The table below recalls how the mechanical external risk signal is determined based on the number of breaches under the baseline scenario (first column) and the stress scenarios (second column) for the four debt burden indicators. For further explanation, please see Station 9.
| Number of Breaches Under the Baseline Scenario |
Number of Breaches Under the Stress Scenario |
|
| 0 | 0 | |
| 0 | 1+ | |
| 1+ | 1+ |
The overall risk of public debt distress (low, moderate, or high) is derived based on joint information from the five debt burden indicators: the four from the external block, as explained above, plus the PV of total public debt-to-GDP, which is compared with its estimated indicative benchmark.
Single one-year breaches are automatically deemed away.
Final External Risk of Debt Distress
Occurs when the PPG external debt has a low risk signal (none of the PPG external debt burden indicators breach their respective thresholds under the baseline or the most extreme stress test) and judgement based on country-specific knowledge is applied.
Occurs when the PPG external debt has a moderate risk signal (none of the PPG external debt burden indicators breach their thresholds under the baseline, but at least one indicator breaches its threshold under the stress tests) and judgement based on country-specific knowledge is applied.
Occurs when any of the PPG external debt burden indicators breaches its threshold under the baseline and judgement based on country-specific knowledge is applied.
The final overall risk of public debt distress (low, moderate, or high) can also be different from the mechanical signals through judgement.
The external debt distress risk rating remains the primary DSF output, while the overall risk of public debt distress is considered supplementary information.
The "Output 7 - Risk Rating" sheet includes the final external and overall risk of debt distress ratings. It also provides granularity and insight into applications of judgement.
 Takeaways for Station 6
- Debt burden indicators under the baseline scenario determine the mechanical high risk signal; the stress test scenarios determine the mechanical moderate risk signal.
- A short-lived (one-year) breach for each debt burden indicator is automatically disregarded.
- Signals from the market financing tool are applied to the final risk rating through judgement.
Final External and Overall Risk of Debt Distress
Users should select the final external and overall risk of debt distress.
Granularity
The granularity should be entered by the user.
Judgement
If any judgement was applied, users should enter a summary here.
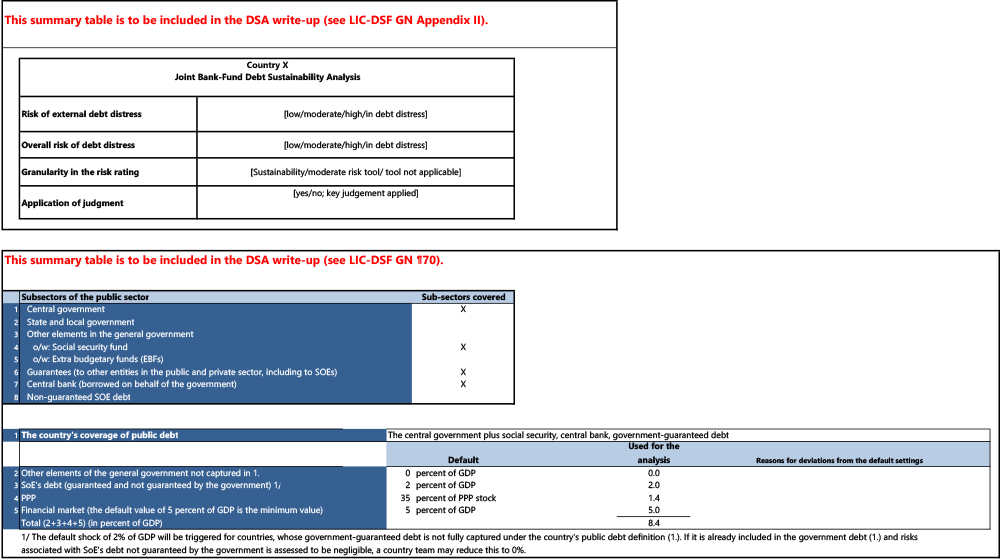
Coverage of Public Sector
Coverage of the public sector is displayed here. This is based on the input from the "Input 2 - Debt Coverage" sheet.
Calibration of the Contingent Liability Stress Test
This table displays the calibration of the contingent liabilities stress test, as entered in the "Input 2 - Debt Coverage" sheet.


