All children should be able to read by age 10. Reading is a gateway for learning as the child progresses through school – and, conversely, an inability to read constrains opportunities for further learning. Beyond this, when children cannot read, it’s usually a clear indication that school systems aren’t well organized to help children learn in other areas such as math, science, and the humanities. And although it is possible to learn later in life with enough effort, children who don’t read by age 10 – or at the latest, by the end of primary school – usually fail to master reading later in their schooling career.
A quality education for all children is fundamental to the success of the Sustainable Development Goals (SDGs), a set of global objectives to reduce hunger and poverty and improve living standards worldwide by 2030. Poor outcomes in education – and particularly the ability to read at grade level – is the leading edge of a learning crisis that threatens countries’ efforts to build human capital and achieve the SDG agenda.
Even before COVID-19 disrupted education systems around the world, it was clear that many children around the world were not learning to read proficiently. Even though most children are in school, a large proportion are not acquiring fundamental skills. Moreover, 260 million children are not even in school. Without foundational learning, students often fail to thrive later in school or when they join the workforce. They don’t acquire the human capital they need to power their careers and economies once they leave school, or the skills that will help them become engaged citizens and nurture healthy, prosperous families. As a major contributor to human capital deficits, the learning crisis undermines sustainable growth and poverty reduction.
To spotlight this crisis, the World Bank and the UNESCO Institute for Statistics jointly constructed the concept of Learning Poverty and an accompanying indicator.
Learning poverty means being unable to read and understand a simple text by age 10. This indicator brings together schooling and learning indicators. It begins with the share of children who haven’t achieved minimum reading proficiency (as measured in schools) and is adjusted by the proportion of children who are out of school (and are assumed not able to read proficiently).
Using a database jointly developed by the World Bank and the UNESCO Institute for Statistics, calculations from learning assessments and enrollment information determined that 53 percent of children in low- and middle-income countries cannot read and understand a simple story by the end of primary school. In poor countries, the level is as high as 80 percent. Such high levels of illiteracy are an early warning sign that SDG 4 for education and all related global goals are in jeopardy. COVID-19 is likely to further exacerbate the already high levels of learning poverty.
Progress in reducing learning poverty is far too slow to meet the SDG aspirations: at the current rate of improvement, in 2030 about 43 percent of children will still be learning poor. Even if countries reduce their learning poverty at the fastest rates we have seen so far in this century, the goal of ending it will not be attained by 2030. COVID-19 further threatens countries’ abilities to meet learning targets.
There is an urgent need for a society-wide commitment to invest more and better in people. If children cannot read, all education SDG targets are at risk. Eliminating learning poverty is as important as eliminating extreme monetary poverty, stunting, or hunger. To achieve it in the foreseeable future requires far more rapid progress at scale than we have yet seen.
Why focus on reading?
1. Reading proficiency is an easily understood learning measure
2. Reading is a student’s gateway to learning in other areas
3. Reading proficiency can serve as a proxy for foundational learning in other subjects
The learning poverty indicator allows us to illustrate progress toward SDG 4’s broader goal to ensure inclusive and equitable quality education for all. It particularly highlights progress towards SDG 4.1.1(b), which specifies that all children at the end of primary reach at least a minimum proficiency level in reading.
Methodology
The indicator combines the share of primary-aged children out of school who are schooling deprived (SD), and the share of pupils below a minimum proficiency in reading, who are learning deprived (LD). By combining schooling and learning, the indicator brings into focus both “more schooling”, which by itself serves a variety of critical functions, as well as “better learning” which is important to ensure that time spent in school translates into acquisition of skills and capabilities.
How Learning Poverty is defined
The learning poverty indicator is calculated as follows:
LP = SD + [(1-SD) x LD]
LP = Learning poverty
LD = Learning deprivation, defined as share of children at the end of primary who read at below the minimum proficiency level, as defined by the Global Alliance to Monitor Learning (GAML) in the context of the SDG 4.1.1 monitoring
SD = Schooling deprivation, defined as the share of primary-aged children who are out of school. All out-of-school children are assumed to be below the minimum proficiency level in reading.
Learning poverty can be improved in two ways: (i) by reducing learning deprivation as countries raise proficiency levels for children below the minimum proficiency threshold, or (ii) by reducing schooling deprivation as countries expand coverage, bringing out-of-school children into the system.
While schooling deprivation can be directly observed depending on whether the child is enrolled or not enrolled in school, learning deprivation cannot be directly observed, and is measured through standardized assessments using the SDG 4 definition of minimum proficiency level, where reading proficiency is defined as:
"Students independently and fluently read simple, short narrative and expository texts. They locate explicitly-stated information. They interpret and give some explanations about the key ideas in these texts. They provide simple, personal opinions or judgements about the information, events, and characters in a text.”
(UIS and GAML 2019)
Learning poverty level, gap, and severity
The learning poverty level (or headcount ratio) shown above, that is the share of 10-year-olds who are not in school (schooling deprived) or are below the minimum proficiency level (learning deprived), has limitations. It does not capture the average learning shortfall among children under the minimum proficiency level. In other words, it does not allow us to know how far the average learning deprived child is from the minimum proficiency threshold and the extent of effort needed to lift children out of learning deprivation. Hence, we include the learning deprivation gap, that measures the average distance of a learning deprived child to the minimum proficiency level and indicates the average increase in learning required to eliminate learning deprivation among children in school.
However, the gap measure cannot distinguish between an increase in the learning gap driven by students near the threshold and one driven by those at the very bottom of the learning distribution. In other words, some learning poor children might be right under the minimum proficiency threshold while others could be much further away, with both groups of children requiring different levels of effort to escape learning deprivation. Learning deprivation severity captures the inequality of learning among the learning poor population, and allows monitoring changes in the learning distribution among the learning poor.
The concepts of learning deprivation gap and learning deprivation severity are important to fully understand children’s learning. It is possible that countries with the same learning poverty level have different learning deprivation gaps, or countries with the same learning deprivation gaps have different learning deprivation severity, with implications for policies used to accelerate learning.

*See the dynamic version of the graph here.
For example, where two countries have the same level of learning poverty, but one has a higher learning deprivation gap, the latter would need greater effort to bring children above the minimum proficiency level, for example, through a focus on policies aimed at building foundational skills. At the same time, where two countries have the same learning deprivation gap, but one has higher learning deprivation severity, the latter would need to adopt strategies that address the unequal distribution of learning among those below the minimum proficiency threshold, for example, through a focus on policies that encourage adaptive and flexible teaching to meet the diverse learning needs of students. Furthermore, as we anticipate learning losses due to the pandemic, or the growing share of children who are learning poor, we can examine widening inequalities with the gap and severity calculations.
Finally, we can combine learning deprivation gaps or learning deprivation severity with a measure of schooling deprivation (or out-of-school population) to understand learning poverty gaps and learning poverty severity respectively. The learning poverty gap gives an indication of the average effort needed to bring children already in school above minimum proficiency and to increase access to schooling among those who are out of school. The learning poverty severity gives an indication of the inequality in learning among the learning deprived children already in school and the effort needed to tackle schooling deprivation.
Calculation details
The implementation of the learning poverty indicator and the production of the global estimates rely on:
· Reporting window of 9 years, a ±4 interval around a reference year. In the first release of the learning poverty, the reference year was set to 2015, implying data from 2011-2019 could be included. In practice, most recent data was from 2017. In the latest release, the reference year is 2017, implying data from 2013-2021 could be included.
· Learning assessments with a minimum proficiency threshold benchmarked by Global Alliance to Monitor Learning (GAML), which occurred within the reporting window. If a country has multiple eligible learning assessments, the following hierarchy is applied: International assessment in reading > International assessment in a subject other than reading > National assessment. Between two rounds of the same assessments, the one closest to the reference year is preferred.
· School participation is derived from adjusted net enrollment rate (ANER) for primary schools and computed by the UIS using administrative records. Adjusted net enrollment is a measure of both “stock” and “flow” and accounts for both age- and grade-based distortions, as it is the percent of primary school age children enrolled either in primary or secondary education, as opposed to gross enrollment which is the share of children of any age that are enrolled in primary school, or net enrollment which is the share of primary school age children that are enrolled in primary school. We use the same year of school participation as the preferred learning assessment for each country, depending on data availability.
· Aggregations for each region comprise the average learning poverty of countries with available data, weighted by their population ages 10–14 years old. To obtain a global estimate, we weight the regional aggregations by the 10–14-year-old population regardless of data availability. This is equivalent to imputing missing country data using regional values.
Note: While the reference age for Learning Poverty is age 10, learning assessments are sampled based on specific grades and not age. To incorporate assessments administered at different grades, we chose for each country the grade between 4 and 6 where relevant and reliable data were available.
Data
You can download the Learning Poverty data directly from Development Data Hub. The database contains pooled and gender-disaggregated indicators for percent of children in learning poverty, percent of primary school-aged children who are out of school, and percent of children below minimum proficiency in reading at the end primary.
You may also access the learning poverty data directly through EdStats.
To load the Learning Poverty data directly in Stata you can use this code:
// Install the user-written command if you don't have it
capture which wbopendata
if _rc == 111 ssc install wbopendata
// Query Learning Poverty indicator from World Bank API
wbopendata, indicator(SE.LPV.PRIM) latest long clear
To load the Learning Poverty data directly in Python you can use this code:
# Load the package
import wbgapi as wb
# Query the most recent non-empty value (mrnev parameter)
df = wb.data.DataFrame('SE.LPV.PRIM', db=12, mrnev=1, columns='time', numericTimeKeys=True)
Current findings
Learning poverty map
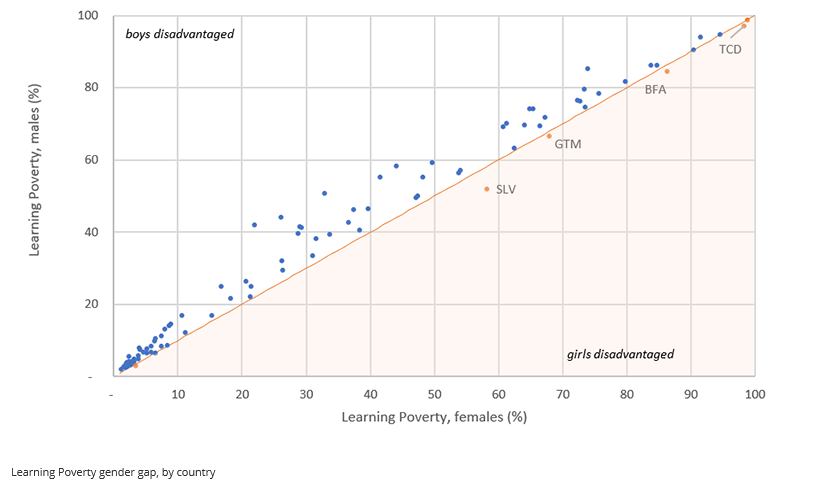
The map below is a snapshot of Learning Poverty across the world. You can also view the indicator for females and males. You may edit this map directly in DataBank.