Challenge
Uganda mostly exports agricultural products (80 percent of total exports). The most important exports is coffee (22 percent of total exports) followed by tea, cotton, copper, oil and fish. Uganda’s main export partners are Sudan (15 percent), Kenya (10 percent), DR Congo, Netherlands, Germany, South Africa and UAE (Trading Economics 2020). But between 1995 and 2010, declining soil fertility, a reliance on rainfall, shrinking wetlands and deforestation have contributed to roadblocks in the growth of the agricultural sector. At the same time, demand for water supply by municipalities has increased, while poor water resources management has worsened the impact of droughts. Protection of water resources were limited and usually not considered for water projects before WMDP.
Approach
The project focused on a participatory planning process in the Kyoga and Upper Nile Water Management Zones (WMZs), and the improvement of the national water resources monitoring and information system. Specific activities included the preparation of Kyoga and Upper Nile Water Management Zones (WMZs) strategies, the development of a water information system (WIS), and network enhancement for water quality, pollution, surface and ground monitoring – among other services.
To ensure the long-term availability and improved quality of water supply through enhanced source protection, the project helped construct, improve and expand priority water supply infrastructure and sewerage services in municipalities. Specific activities included creating or updating feasibility studies, engineering designs, and document preparation for water and sanitation infrastructure systems. The project also implemented environmental and social mitigation measures. Integrated water resource management is a norm for any water project in Uganda now.
Results
- The project benefited 1,034,000 individuals with access to improved water sources, protected sanitary zones and increased potential for water debit from natural sources.
- 5,590 hectares of area under integrated water resources management and development in selected catchments were supported, including through the development of four Water Management Zones (WMZ), four Catchment Management Plans and a Water Resources Strategy
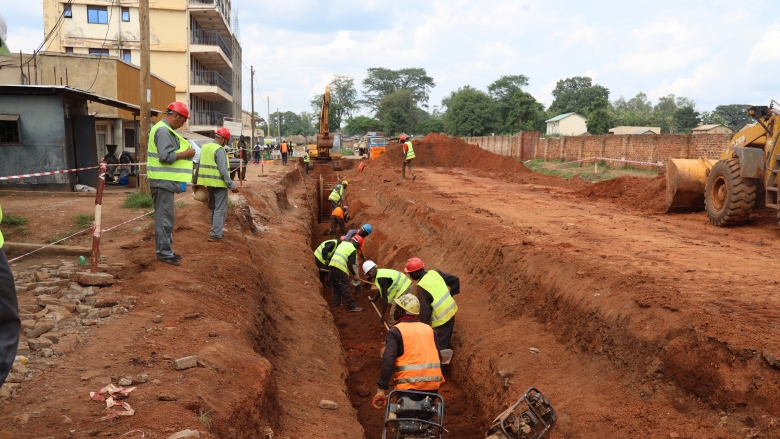
- The new water intake systems and water treatment facilities were built in 10 towns, water network was expanded, and new water and wastewater connections were constructed. In Arua, two wastewater treatment plants and one fecal sludge management plant were constructed and became fully operational.
- From 2012-2018, the number of piped household water connections benefiting from rehabilitation works increased from 14,332 connections to 25,000 connections.
The Table below presets the key performance indicators for the largest towns under the WMDP (*In parenthesis – percent of household connections)
|
Service Coverage (%)*
|
Hours of Operation per Day | Cost-recovery | |||
Name of the town | 2013 | 2018 | 2013 | 2018 | 2013 | 2018 |
Arua | 96 (79) | 100 (81) | 3 | 24 | 1.03 | 2.07 |
Bushenyi | 26 (23) | 100 (72) | 2 | 24 | 1.03 | 1.11 |
Katwe | 10 | 100 (45) | Several hours per week | 24 | 0.50 | 1.06 |
Gulu | 45 (30) | 70 (50)[1] | 5 | 18 | 0.83 | 1.15 |
