

Purchasing power parities (PPPs) are primarily used to convert economies’ national accounts expenditures on GDP and its components into a common currency. PPPs control for differences in price levels between economies and equalize the purchasing power of the various currencies used across economies, thus enabling cross-country comparisons that reflect only differences in the volume of national economic outputs. PPPs are also used to derive spatial price level indexes (PLIs), that is, the ratio of an economy’s PPP to its market exchange rate. As such, PPPs are used in many analyses, and the applications of PPPs presented in this visual guide cover a wide range of uses by data compilers and agencies responsible for data indicators. However, compilers and users should be mindful of the appropriate use of PPPs provided by the International Comparison Program (ICP). The following guidelines, limitations, and recommended uses of PPPs set out the analyses for which they are suitable from a methodological standpoint and should guide data compilers in their production of PPP-based indicators as well as users in their scrutiny of PPP-based data. Box 1 provides a summary of these recommendations.
Box 1 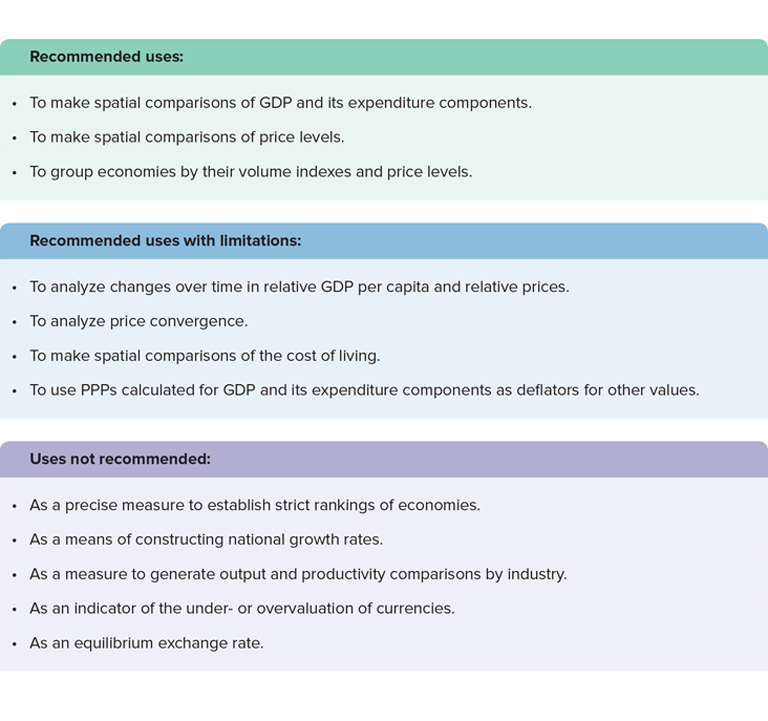
ICP PPPs are published for GDP and selected expenditure components (see Table 1 in the technical note and the ICP Classification of Expenditures). Many applications and indicators use PPPs estimated at the level of GDP or at the level of Households and Nonprofit Institutions Serving Households (NPISHs) Final Consumption Expenditure (otherwise known as private consumption), which reflect the average difference in prices between countries across the whole economy or for those goods and services that fall under private consumption, respectively. PPPs for expenditure components below these levels reflect the price differences between countries for the goods and services that fall within the expenditure component and hence they may be used for specific analyses. For example, the expenditure component for total Health is the sum of household consumption expenditure and expenditures by nonprofit institutions serving households (NPISHs) and government on medical products, appliances, and equipment, outpatient services, and hospital services actually consumed by households. Therefore, ICP PPPs at the level of total Health reflect price levels of the goods and services being consumed on health, rather than the general price levels prevalent in the economy, and hence they may be used to measure the volumes of health goods and services consumed.
In a similar way, users wishing to make comparisons of goods and services consumed by households and individuals, or the incomes needed to purchase these items, as well as comparisons of material well-being, should use PPPs at the level of private consumption or actual individual consumption, rather than at the level of GDP. A fuller discussion is devoted to this in the section Per capita measures in Chapter 1. Annual GDP and private consumption PPPs are available through the World Bank’s World Development Indicators (WDI). The ICP database in the World Bank’s Databank provides PPPs for the 44 expenditure components listed in Table 1 for the ICP reference years 2011 and 2017, while PPPs at the level of GDP, Households and Nonprofit Institutions Serving Households (NPISHs) Final Consumption Expenditure, Actual Individual Consumption, General Government Final Consumption Expenditure, Gross Fixed Capital Formation, and Domestic Absorption are provided for the interim years 2012 to 2016.
The ICP does not use the production approach nor the income approach to measuring GDP. Instead, ICP comparisons of GDP are based on the expenditure approach, where GDP is measured as the sum of the final expenditures on goods and services plus exports less imports of goods and services as defined by the United Nations System of National Accounts. This expenditure approach allows comparisons of the levels and structures of the principal elements of final demand, that is, consumption and investment, at the level of GDP and at the detailed breakdown levels of GDP into its expenditure components. However, it does not allow for the estimation of PPPs for individual industries or sectors; this would only be possible if ICP PPPs were estimated from the production side, instead of from the expenditure side. Thus, productivity comparisons using ICP PPPs can only be made at the level of GDP and not separately for the individual sectors and industries that make up an economy.
While ICP PPPs are available for different expenditure components, they do not reflect the consumption habits of any particular population group, such as the affluent or those living below poverty thresholds. Instead, the basket of goods and services and expenditures used to calculate ICP PPPs represents the average consumption within an economy. Recent studies have attempted to estimate PPPs for certain population groups, such those living below poverty thresholds; however, the results indicated that these PPPs are not significantly different from the ICP PPPs, as the relative difference in price and expenditure patterns between certain population groups within an economy tend to be similar to the differences observed between comparable groups in other economies. In Chapter 2 analyses of poverty and inequality based on income or consumption levels are measured using PPPs at the level of Households and Nonprofit Institutions Serving Households (NPISHs) Final Consumption Expenditure.
With regards to subnational and urbanization analyses, ICP PPPs are pertinent to countries or economies as a whole and hence they cannot be used in comparisons between subnational regions or between urban and rural areas within an economy. Some economies use ICP methods and subnational data to estimate PPPs at the subnational level to illustrate intra-country differences in prices and their effect on the cost of living and the purchasing power of incomes. Examples of this type of exercise in Vietnam, the United States, and the United Kingdom are presented in the section Subnational analyses in Chapter 1.
ICP comparisons include myriad economies ranging from city-states, such as Singapore, and small islands, such as Grenada, to large and diverse economies, such as Brazil, China, India, the Russian Federation, South Africa, and the United States. Because of wide differences in the price and structure of economies and the inherent statistical variability in the methods used to calculate PPPs, comparisons between economies that are similar are more precise than comparisons between economies that are dissimilar.
ICP PPPs are estimated using prices collected in a given reference year, or cycle. Thus, ICP PPPs and PPP-based expenditures estimated at different points in time cannot be directly compared, nor be used to measure domestic inflation, as they represent both changes in volume and in price between the two periods. To isolate changes in volume it is necessary to select a base year and to extrapolate its relative volume levels over the other years by applying the relative rate of volume growth. This provides a time series of volume indices at a constant uniform price level that replicates exactly the relative movements of the volume growth of each economy. Users should note that underlying this method is the assumption that price structures and relatives do not change over time. However, relative prices do change over time and, if such changes are ignored over long periods, a biased picture of the relative growth and development of economies can result. The choice of base year can also influence the picture that emerges. The temporal analyses provided in this publication use this approach of constant prices - that is, a base year’s PPP is applied as the conversion factor to all data points, with the expenditures over time being expressed in constant PPP dollars. The base year chosen is usually an ICP reference year. On the other hand, current PPP dollars refer to the PPPs for each year being applied to the values expressed in the current prices of a single year. Typically, analyses focusing on one year’s data use current PPP dollars.
The convergence or divergence of prices among economies is relevant to competition policy and consumer protection. ICP PLIs provide a means of observing the movement of price levels over time, but they should be used with caution as they are influenced by market exchange rate fluctuations. Furthermore, there may be volatility when the basket of goods and services to be priced changes from one price survey to another in order to accommodate market developments. For example, the basket for food and non-alcoholic beverages is relatively stable, while that for electronic goods is updated each time it is surveyed as technology evolves at a fast rate. Volatility is also seen at lower levels of aggregation, where sample sizes are small. For these reasons, PLIs are better suited to monitoring price convergence at higher levels of aggregation over long periods of time.
ICP PPPs should not be interpreted as equilibrium exchange rates. They refer to the entire range of goods and services that make up GDP and include items such as construction, housing, health, education, and government services that are not traded internationally. Moreover, PPPs are calculated using expenditure weights that reflect domestic demand. Market exchange rates are determined by the total demand for a particular currency, and financing foreign trade and capital transfer are components of this demand. PPPs, therefore, cannot be used to indicate an economy's “correct” exchange rate and therefore cannot serve as an indication as to whether the currency of an economy is under- or overvalued.
ICP PPPs are not designed to make international comparisons of monetary flows, such as aid and foreign direct investment, or trade flows. For such comparisons, market exchange rates should be used. Note that many international comparisons require neither PPPs nor market exchange rates. For example, to compare real growth rates of GDP between economies, each economy’s own published growth rate can be used. Similarly, a comparison of government debt as a ratio of GDP can be calculated in each economy’s own currency.
The ICP provides users with a comprehensive and high-quality dataset of economic measures based on consistent methods being applied across all participating economies. Data are collected according to robust classifications and processes and are validated throughout data collection and compilation. Nonetheless price and expenditure data are subject to sampling, measurement, and classification errors. Additionally, the measurement of GDP is not uniform over all participating economies and the GDP of those with a high proportion of nonobserved economic activities, such as a large informal sector, could be underestimated. Furthermore, the estimation of the population size of each economy is also subject to measurement errors related to the quality of the underlying data.
Thus, PPPs are statistical estimates rather than precise measures and should be treated as approximations to true values. Users should therefore be cautious of drawing conclusions based on small differences in PPP-based expenditures or price levels between economies. Additionally, PPP-based estimates and indexes at the higher levels of aggregation are more reliable. At lower aggregation levels, estimates are likely to have slightly larger error margins. Furthermore, PPPs based on the prices of goods are more precise than PPPs based on the prices of services. Due to the complexity of the processes used to collect the data and calculate PPPs, it is not possible to directly calculate margins of error.
Further information on the recommended uses, limitations, and main applications of PPPs and other ICP data is provided on the ICP website and in Chapter 3 of Purchasing Power Parities and the Size of World Economies: Results from the 2017 International Comparison Program.