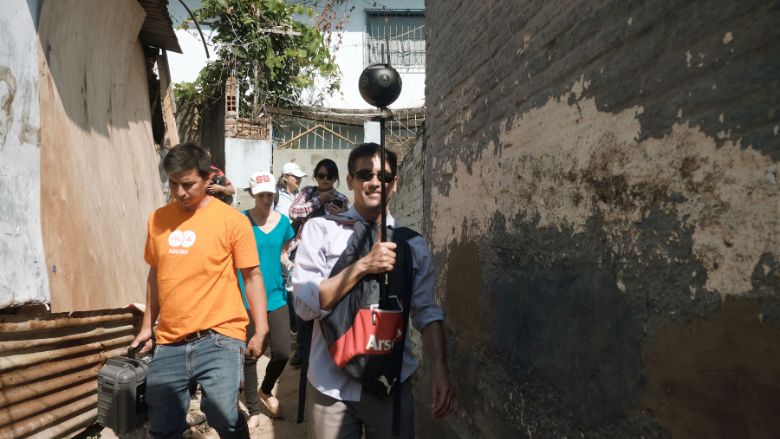
In late 1981, the legendary urban design expert Allan B. Jacobs was walking along a road in Tangshan, China, visiting a new housing development when he noticed improvised, hand-made grates covering many windows and porches. He commented to his Chinese colleague that in the United States, such grates would indicate to visitors that the residents considered the neighborhood unsafe. When his colleague confirmed the same was true in China, Jacobs realized that most professions use these types of simple visual clues as a way to understand a neighborhood and wondered why urban planners did not follow suit.
This is how Jacobs opens his seminal book, Looking at Cities, dedicated to the art of urban observation and detection of urban clues.1 Four decades later, Jacobs’ framework remains relevant, even as the tools we use to study and visualize cities have transformed.We no longer require a notebook and comfortable shoes to understand an urban environment. Today, from a continent away, we can see not just whether a neighborhood has grates on its windows, but also whether building foundations are cracking, roads are paved, and sidewalks navigable for wheelchairs. Quite simply, with a computer and internet connection, we can bring Jacobs’ approach to almost any neighborhood anywhere in the world.
Recent technological advancements enable us to efficiently review images, identify urban clues, and reveal spatial patterns across an entire neighborhood or city. By applying machine learning algorithms to high-resolution imagery taken above the city (aerial imagery) and at ground level (street view imagery), we can make comprehensive, multi-view urban observations from the sky and street. The resulting georeferenced datasets and accompanying visualizations hold enormous potential to help create resilient, healthy communities. That includes unprecedented opportunities for spatial planning, disaster and climate risk management and reduction.
Using this data, planners and engineers can analyze built components to gather clues about blocks, neighborhoods, and cities through access to a wide-ranging overview of specific urban characteristics, such as each unit’s:
- Size (area, height, and volume of building)
- Use (residential, commercial, critical infrastructure, or mixed)
- Masonry (unreinforced, reinforced, or unknown)
- Vintage (for example, pre-1940, 1941-1974, 1975-1999, and 2000-present. These are locally determined based on field surveys conducted by structural engineers.)
- Roof condition (good, fair, poor, under construction or vacant)
- Roof material (concrete, metal, mixed, tile, other)
- Wall condition (good, fair, poor)
- Wall material (typically: brick or concrete block, plaster, mix/unclear/other; can include: wood – polished, wood - crude/plank, adobe, corrugated metal, stone with mud/ashlar with lime or cement, container/trailer, plant material)
- Total condition (composite estimation based on roof and wall conditions)


